Featured

Unravelling the Mysteries of Trans-Equatorial Propagation: A 2024 Perspective

Introduction

Trans-Equatorial Propagation (TEP) is a fascinating phenomenon that allows for the propagation of VHF and UHF signals over long distances, particularly along a north-south path that crosses the magnetic equator. While TEP has been observed and studied for many years, the exact mechanisms behind it are complex and not fully understood.

The Science and Mathematics Behind TEP

The ionosphere, a layer of the Earth’s atmosphere that is ionized by solar and cosmic radiation, plays a crucial role in TEP. The ionosphere is often modelled as a series of horizontal layers that vary with time, location, and sunspot activity. However, the real ionosphere, particularly in equatorial and polar regions, is much more complex.

One of the key features of the equatorial ionosphere that gives rise to TEP is the equatorial anomaly. This is where a high electron concentration is found on each side of the magnetic equator, usually seen in the region of 10 to 20 degrees latitude. The afternoon TEP is believed to occur when a signal is reflected first by an anomaly on one side of the equator and then again by another anomaly on the other side.

Evening TEP is less well understood but is believed to rely on “ionospheric bubbles” – areas of high ionization density off which signals are reflected. Other features of the ionosphere that give rise to these unusual modes include sporadic-E, the equatorial ionization enhancements, ionospheric tilts at twilight, and ionospheric irregularities such as equatorial spread-F.

The mathematical modelling of TEP involves understanding the behaviour of radio waves as they interact with these ionospheric layers. This is typically done using the principles of electromagnetic wave propagation, which are governed by Maxwell’s equations. The propagation of signals in TEP is often modelled using ray tracing techniques, which involve solving a set of differential equations that describe the path of the radio wave as it travels through the ionosphere. These equations consider the varying electron density in the ionosphere, as well as the frequency of the radio wave.

Web-Based Radio Systems Studying TEP

With the advancement of technology, web-based radio systems have become a valuable tool in studying phenomena like TEP. These systems allow for real-time monitoring and data collection from various locations around the world, providing a wealth of information for researchers. They can track changes in signal strength, propagation times, and frequencies of occurrence, contributing to our understanding of TEP1.

Recent Breakthroughs in TEP Research

There have been several recent breakthroughs in TEP research. A study by Keisuke Hosokawa and his team investigated the feasibility of monitoring equatorial plasma bubbles (EPBs) using VHF radio waves used for aeronautical navigation systems. This study represents a significant step forward in the use of existing infrastructure for the wide-area monitoring of EPBs2.

A comprehensive overview of TEP was provided, detailing its historical context, occurrence times, and the characteristics of afternoon and evening TEP. This resource serves as a valuable reference for both newcomers and experienced researchers in the field1.

How Can Radio Amateurs Contribute?

Radio amateurs can contribute to the study and understanding of TEP in several ways. By operating on the VHF and UHF bands, particularly around the equinoxes when TEP is most prevalent, radio amateurs can collect valuable data on signal strength, propagation times, and frequencies of occurrence. Sharing these observations with the scientific community can provide real-world data to support theoretical models and predictions1.

Amateurs can also conduct their own experiments to test theories and hypotheses about TEP. This could involve varying the frequency, time of day, or antenna configuration to see how these factors influence TEP1.

Practical Examples of TEP Observations

TEP was first noticed in the 1940s by both military and amateur operators who discovered that it is possible to communicate in the VHF band over intercontinental distances during times of high sunspot activity. The first organized and therefore relatively large scale TEP communications occurred during 1957-1958 in the peak of sunspot cycle 191.

There are two distinctly different types of TEP that could occur. The first type occurs during the late afternoon and early evening hours and is generally limited to distances under 6000 km. Signals propagated by this mode are limited to the low VHF band (<60 MHz), are of high signal strength and suffer moderate distortion (due to multipath). The second type occurs around 2000 to 2300 local time and is more frequent around the equinoxes and especially at times of high sunspot activity. Signals may have doppler spread, are subject to rapid fading and strong distortion, and path lengths are usually between 3000 and 8000 kilometers1.

TEP can also occur in the late morning hours, allowing for radio communication between southern UK and Southern Europe (Greece, Malta, Spain) and South Africa. During these times, the ionospheric conditions can align in such a way that VHF signals are able to travel over the equator, allowing for communication between these regions. In some cases, as per personal experiences and observations, these distances can extend up to at least 8900 km.

While VHF TEP is more commonly discussed, UHF TEP also occurs, albeit less frequently. In the article “Transequatorial Propagation, TEP: Everything You Need to Know”, it is mentioned that workable contacts have been made on 144MHz (2 meters) and sometimes on 432MHz (70 centimetres), which falls in the UHF band1. This shows that while UHF TEP is less common than VHF TEP, it is indeed possible and has been observed by radio operators.

Ongoing Research

The International Telecommunication Union (ITU) is actively involved in ongoing research on TEP. They have published a recommendation on the method for calculating sporadic-E field strength, which is relevant to TEP. The ITU Journal has also called for papers on propagation modelling for advanced future radio systems, which includes TEP. Furthermore, a study on monitoring equatorial plasma bubbles using aeronautical navigation systems is a recent development in this field2.

A Radio Amateur can contribute a great deal into the study of the propagation and its characteristics helping to provide essential detail on observations. The first step in the analysis process is always to collect sufficient data and the radio amateur community is well placed to make such a sizable contribution, either through the PropNet or BeaconSpot networks.

Observations are quite easy to make once there is an idea of what and where signals are. The amateur radio community benefits from fixed frequencies for computer-generated modulation schemes, generically called MGM and currently consisting mainly of FT8, FT4, and WSPR modes. WSPR signals monitored by radio amateurs can be automatically logged to the WSPRNet servers, and FT4/FT8 reports can be logged to psk reporter, on 28MHz, 40MHz, and 50MHz [7] (https://pskreporter.info/pskmap.html).

In addition, there are a set of highly reliable transmitters beaconing their callsign details continuously so that, provided someone is listening, if a propagation path occurs there is a great chance the occurrence will be logged.

The allocation at 40Mhz has a small number of beacons running and these are very good indications for possible TEP and other anomalous propagation modes.

The beacons can be found from this table:

BeaconFrequencyLocatorMGMLast QRGODX (km)Status
ZS6WAB40.675KG46rbFT840.674812469On
GB3MCB40.050IO70ojFT840.05006781On
EI1KNH40.013IO63veFT840.01304539On
OZ7IGY40.0702JO55wnPI440.07109479On
S55ZMS40.670JN86crPI440.67508378On
EI1CAH40.016IO53ckPI440.01607585On
ZS6OB40.680KG44deA1A40.68000On
WM2XCS40.685FN20wvA1A40.68507106On
WM2XCW40.680CN88lx40.68002941unkn
ZL2WHO40.687RE79tp40.68700Off
40Mhz Beacons

From this location in south-east England ZS6WAB is currently received (early April 2024) at good strength for about 15-20minutes late morning (between 10:30 – 11:30utc). About an hour after first onset a very week signal returns again for about 15-20minutes before fading out slowly after 30 -45 minutes.

The characteristic observation is that the signal at 40MHz suddenly appears and increase in strength then its strength reduces slowly until it disappears after about 30 – 45 minutes. Then an hour or so later a much weaker signal appears with the same fast onset and slow decay profile before fading out completely for the day. This phenomenon seems to have been also observed by other observing stations.

The signals itself is usually T9, i.e. shows no sign of dispersion (no Doppler spread). Signal amplitude varies but can usually be classed and medium fading.

A Closer Look at ZS6WAB on 40MHz

For some reason yet to be determined parallel reception of ZS6WAB on 28MHz and 50Mhz has yet to be noted at this reception location.

At present there is limited data available so that the current observation windows is restricted from late March to the first week of April 2024.

This is best illustrated in this data table: –

DateTimeBeaconFrequencyRPTDist(km)Spotter
05/04/202412:13ZS6WAB40.67485398187F4CXO
05/04/202410:58ZS6WAB40.67485198187F4CXO
05/04/202410:59ZS6WAB40.67505198303F6ACU
05/04/202411:32ZS6WAB40.67475698836G0API
05/04/202411:20ZS6WAB40.67485498783G4OGI
04/04/202412:05ZS6WAB40.674852978249A5CW
04/04/202411:35ZS6WAB40.67485398187F4CXO
04/04/202411:21ZS6WAB40.67504198303F6ACU
04/04/202411:39ZS6WAB40.67485598784G4OGI
03/04/202411:09ZS6WAB40.67485398187F4CXO
03/04/202413:11ZS6WAB40.67505297485IK0OKY
03/04/202411:23ZS6WAB40.6750519341OH7PS
03/04/202413:07ZS6WAB40.67465597841S59GS
02/04/202410:43ZS6WAB40.67505178249A5CW
02/04/202413:18ZS6WAB40.67505597819EA3ERE
02/04/202410:50ZS6WAB40.67485298187F4CXO
02/04/202410:51ZS6WAB40.67485598249F4FRQ
02/04/202411:08ZS6WAB40.67505398303F6ACU
02/04/202410:39ZS6WAB40.67485498783G4OGI
02/04/202413:15ZS6WAB40.67465597841S59GS
01/04/202411:44ZS6WAB40.6750 8622DH6JL
01/04/202411:54ZS6WAB40.67485798187F4CXO
01/04/202410:26ZS6WAB40.67485198187F4CXO
01/04/202411:33ZS6WAB40.67505798303F6ACU
01/04/202411:30ZS6WAB40.67485498784G4OGI
01/04/202412:33ZS6WAB40.67505597485IK0OKY
01/04/202412:06ZS6WAB40.67505297485IK0OKY
31/03/202411:28ZS6WAB40.67505597819EA3ERE
31/03/202410:40ZS6WAB40.67485398187F4CXO
31/03/202411:45ZS6WAB40.67505498303F6ACU
31/03/202411:14ZS6WAB40.67455797841S59GS
30/03/202410:47ZS6WAB40.67505597819EA3ERE
30/03/202410:21ZS6WAB40.6750529 EI7HBB
30/03/202410:27ZS6WAB40.67485598187F4CXO
30/03/202409:38ZS6WAB40.67485398187F4CXO
30/03/202409:31ZS6WAB40.67485198187F4CXO
30/03/202410:25ZS6WAB40.67505398303F6ACU
30/03/202410:30ZS6WAB40.67475598836G0API
30/03/202410:46ZS6WAB40.67505998647OR7T
29/03/202409:15ZS6WAB40.67505397819EA3ERE
29/03/202412:15ZS6WAB40.67505599167EI2IP
29/03/202411:32ZS6WAB40.67485498187F4CXO
29/03/202410:32ZS6WAB40.67505198303F6ACU
29/03/202411:05ZS6WAB40.67485598836G0API
28/03/202411:44ZS6WAB40.67505597819EA3ERE
28/03/202411:11ZS6WAB40.67485298187F4CXO
28/03/202412:26ZS6WAB40.67485398249F4FRQ
28/03/202412:08ZS6WAB40.67502198303F6ACU
28/03/202411:19ZS6WAB40.67485298836G0API
27/03/202412:33ZS6WAB40.67505597819EA3ERE
27/03/202410:39ZS6WAB40.67485798836G0API
40MHz reception of ZS6WAB March – early April 2024 source:Beaconspot.uk

A general trend showing the expected late morning propagation is clear. Observing stations have either horizontal or vertical polarisation, suggest “simple” antennas in use and reported signal strengths appears to be very similar from southern to northern European observers.

Signals also appear to be described as having “T9” note with some fading.

Conclusion

The study of TEP is a fascinating area of research that continues to challenge and engage the scientific community. While we have made significant strides in our understanding of this phenomenon, there is still much to learn. Through continued research and collaboration between scientists and radio amateurs, we can continue to unravel the mysteries of TEP and enhance our understanding of this complex and intriguing phenomenon. The ongoing research in this field is testament to the complexity and intrigue of TEP. It’s a fascinating area of study that continues to challenge and engage the scientific community. The practical examples and observations of TEP provide valuable insights into this phenomenon and contribute to our understanding of this fascinating area of science. As radio amateurs, we have a unique opportunity to contribute to this field and help advance our understanding of the world around us.

Let’s continue to explore, observe, and share our findings with the world.

References

  1. Unknown Author. (n.d.). Transequatorial Propagation, TEP: Everything You Need to Know1.
  2. Hosokawa, K., Saito, S., Nakata, H., Lin, C. H., Lin, J. T., Supnithi, P., Tomizawa, I., Sakai, J., Takahashi, T., Tsugawa, T., Nishioka, M., & Ishii, M. (2023). Monitoring of equatorial plasma bubbles using aeronautical navigation systems: a feasibility study2.
  3. Unknown Author. (n.d.). Trans-Equatorial Propagation – Amateur Radio Wiki.
  4. ITU. (n.d.). P Series Radiowave propagation.
  5. ITU Journal. (n.d.). Special Issue Propagation modelling for advanced future radio systems.
  6. WSPRNet6 (https://www.wsprnet.org )
  1. Thanks for the UKSMG mention, and the link to the report that Ray Cracknell, G2AHU (former PSC member) wrote in Six News and on which I was a co-author. Unfortunately, it describes a study into troposcatter signals, NOT TEP.

Ray, who died in 2008, was indeed an early pioneer of TEP studies along with Costas, SV1DH, but you’ll need a different reference. I can dig one out if there’s time to change it – let me know and I’ll find it today

  1. Sources

1. Transequatorial Propagation, TEP: Everything You Need to Know

2. Definition and Theory of Transmission Network Planning

3.Beaconspot

Terrestrial Weather

Terrestrial Weather for Microwave Propagation Research

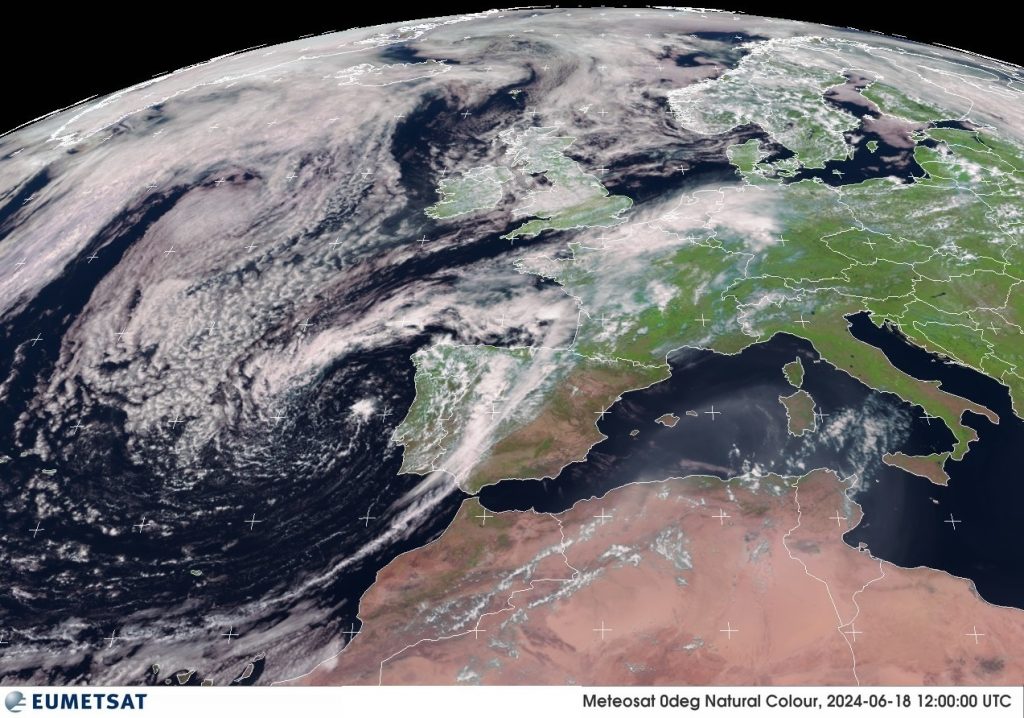
Eumetsat Meteosat Images

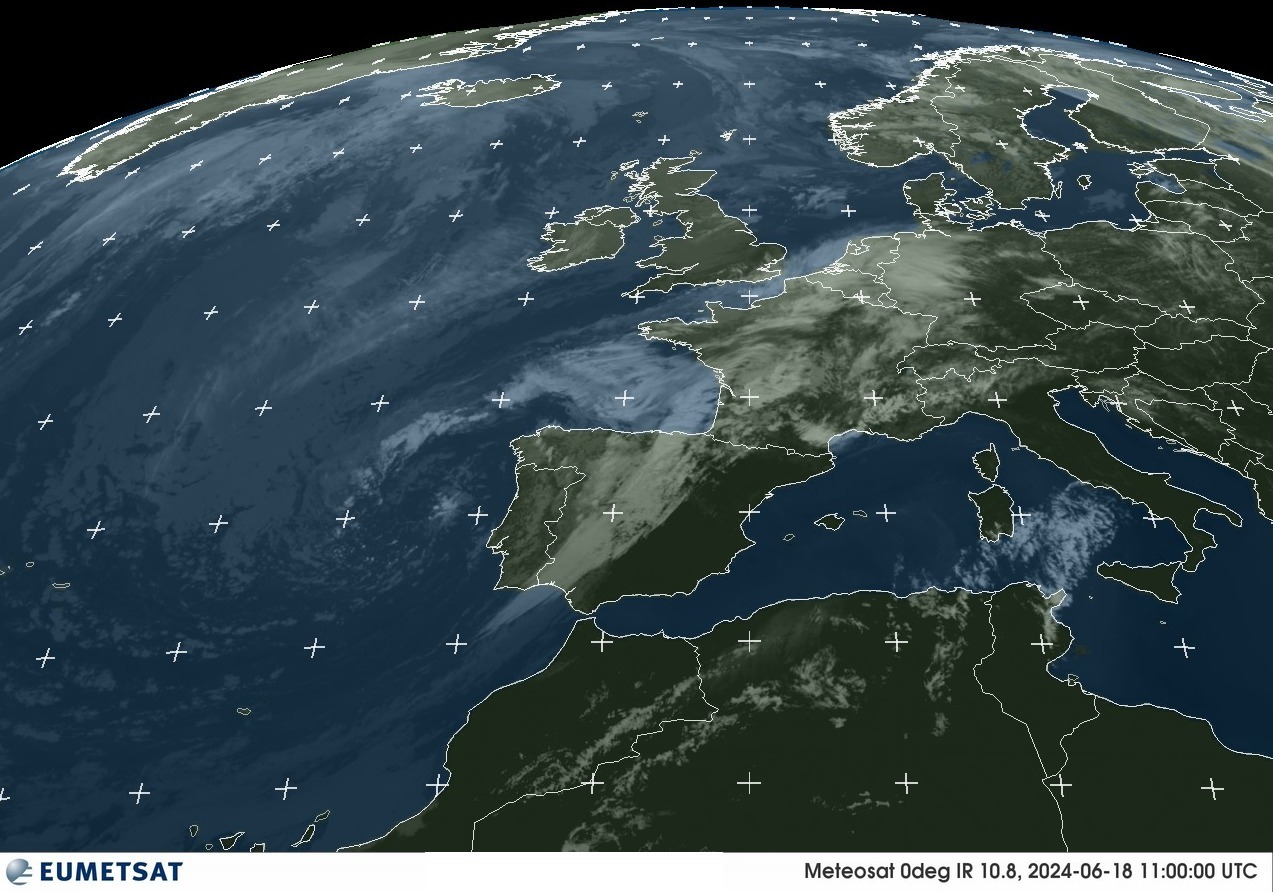
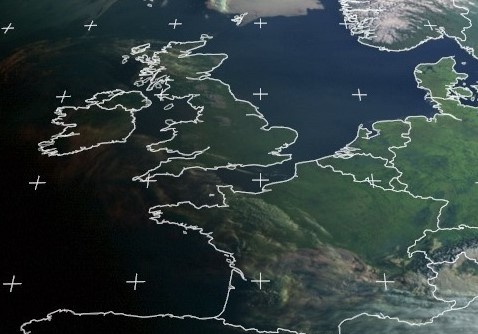
This sequence displays images in the visible spectrum, usually
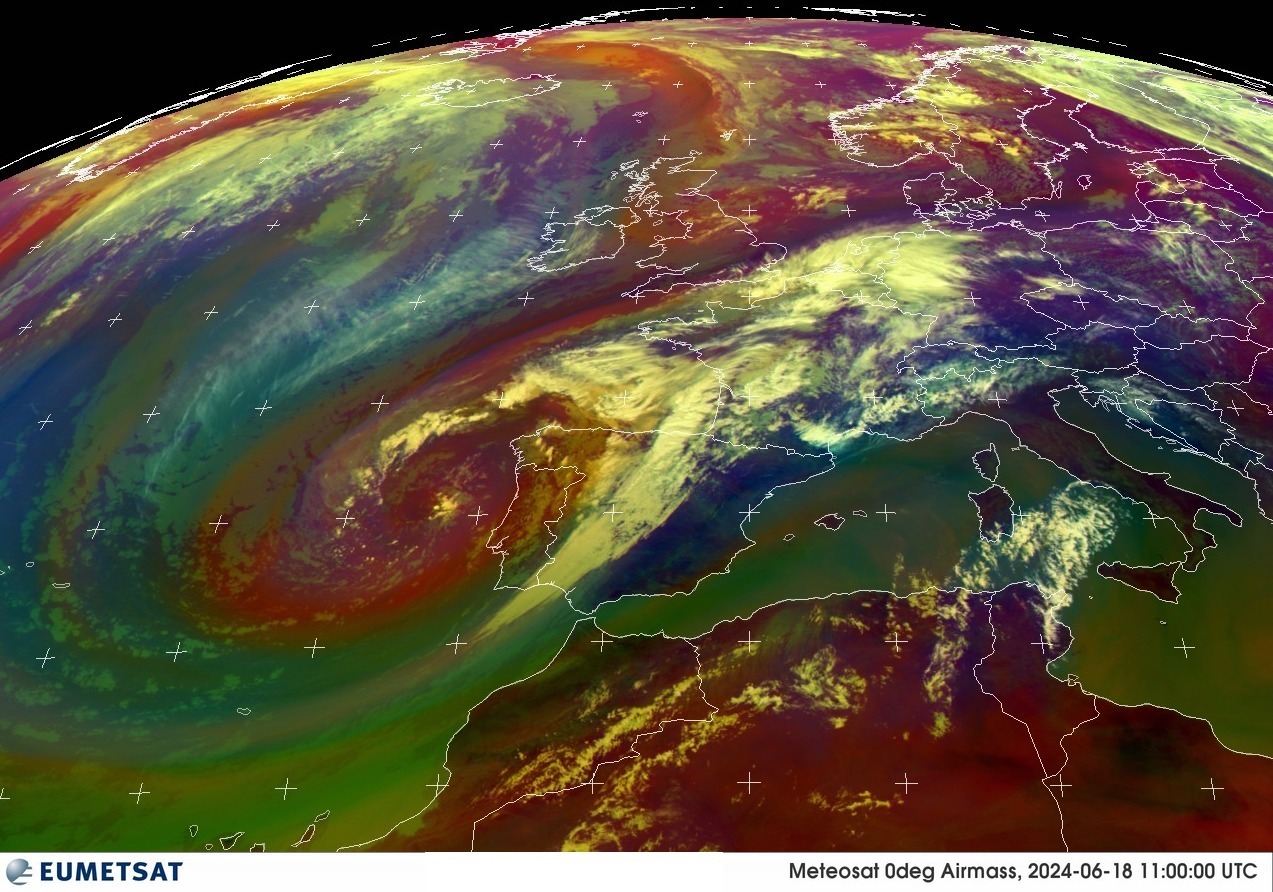
referred to as Enhanced RGB, and the IR 10.8um sensor image. Included in this set an experimental composite image comprising output from multiple sensors each image is updated every (utc) hour.

A Western Europe projection is chosen as this best illustrates how the
weather from the North Atlantic develops and affects the European landmass.
The visible spectrum only shows details once in daylight so will always
appear dark overnight. The IR 10.8um therefore presents a suitable
alternative view as it presents the best compromise on displaying cloud
formations.

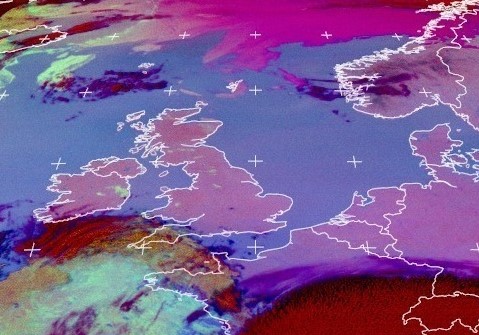
With a little practice looking at the composite image (EUMETSAT_MSG_RGBAirmass) it is possible to build a picture of the height and type of cloud and the veracity of weather systems.
The complex image is included here as it provides near real-time evidence to show large warm airmasses form over the southern North Sea, between the UK, Belgium and the Netherlands causing skewed, turbulent microwave radio paths.

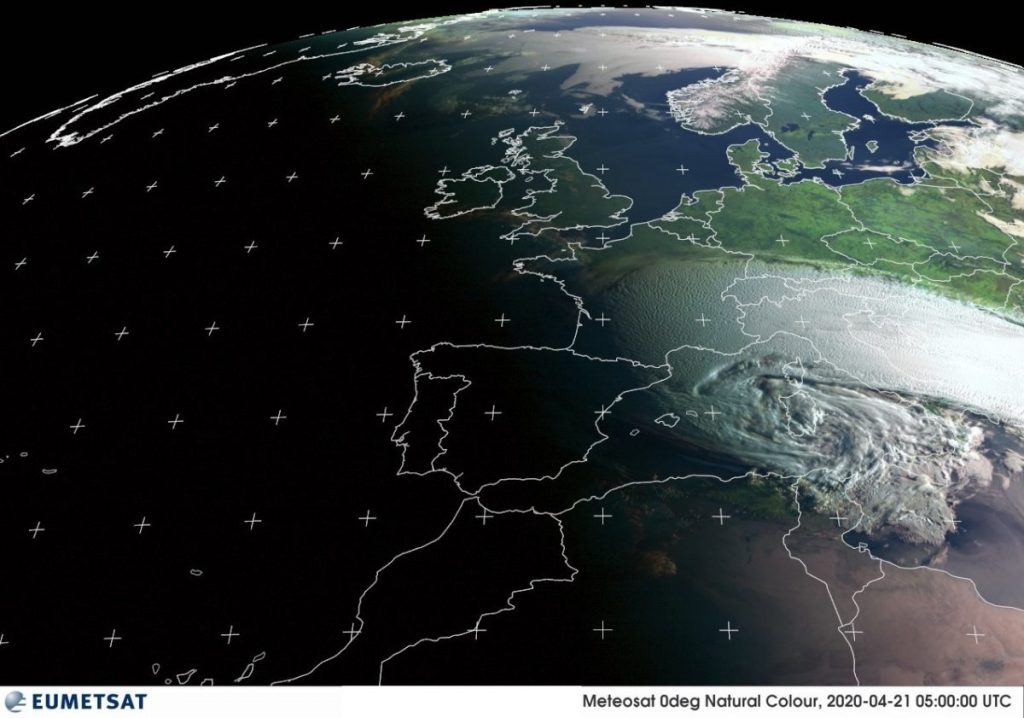
Eumetsat 0° – Natural Colour

Eumetsat 0° – IR10.8um Colour WesternEurope

Eumetsat 0° – RGBAirmass WesternEurope

If this has interested you you will have noticed the images themselves do not update. The fully live site is now available once again at a new address:-
https://g4ogi.uk/Terrestrial_Weather/

VHF/microwave radio propagation during COVID-19 – update November 2020

I have been asked a number of times whether the reduction in air traffic and general effects from rge COVID-19 pandemic have affected radio propagation at VHF through to microwave.

The question, I think, has been prompted from thoughts of lower air traffic (and the the reduced opportunities for air scatter contacts) creating fewer contrails and less “sky haze” which could prompt higher lower atmosphere temperatures and thus increased ducting opportunities.

The short answer is no. I have not seen any evidence to support that premise. It appears there has been a quite neutral effect but I am still assessing data from the last few years in case I find any significant effect .

The problem is in defining what sort of effects is one expecting to see. A school of thought is that we could return to the wide spread Autumn time tropo openings where across most of Western Europe frequencies at VHF and above were affected by elevated ducts under stable High pressure systems providing possibilities of contacts to to at least 1300-1500km. Another school of thought being the exact opposite due to lack of atmospheric seeding by human activity.

As stated the evidence I have seen in my own data on weather systems and reported contacts amateur radio contacts has suggested that there has been no significant difference. It is true that we radio amateurs have experienced some tremendously good propagation during events in September and October (my own prize being 1350km+ on 3cm), but these can not yet be classed as statistically significant when compared to previous years.

Statistical significance is quite crucial in the argument for we have to consider effects such as:-

  1. Activity Levels.
    • Numbers of active radio amateurs
    • Amateur band access
    • Activity reporting/alerts
  2. Technology
    • Signal generation
    • Power levels
    • Antennas
    • Modulation schemes
  3. Weather forecasting
    • Near-real time satellite imaging
    • Access to multi-sensor data
    • Forecasting accuracy
  4. Climate effects
    • AGW
    • Improved monitoring
    • Computer modelling accuracy

Over the last 10,20 or 30 years once can safely say there has been signficant technological improvements in most of the areas above, except in the number of radio amateurs and amateur band access and this present a major threat to further coherent studies as access to 23, 13, 9 and 6cm are all threatened. All these bands have very different tropospheric characteristics and access to this part of the spectrum for terrestrial use is vital for the radio amateur experimenter/researcher.

In short, the changes in the above categories make direct comparison with the sunny, unicorn filled, uplands of past days difficult and impossible to correlate directly.

One just has to look at the effect the FT8 MGM mode has had to summertime propagation on 50MHz, or JT MGM modes on 144/432 MHz to see the difficulties.

Direct access to weather satellite data now provides near real-time data on the lower and more generally upper atmosphere. This has enabled me to nake tentative suggestion on the possibilities of skewed angle propagation , certainly for 3cm and once equipment has been developed, for the other microwave bands below 10GHz. The higher bands 24GHz – 122GHz rely much more on local changes in temperature,pressure, and humidity and these measurements are not yet available with suitable resolution over a large geographical area. In the Netherlands there is an increasing number of interconnected community weather station monitors providing sufficent resolution (and averaged accuracy) that may ber of use. I am not aware of a similar (non-monetary) based scheme in the UK.
The changes in the first three categories are enough to see how complex comparing data even from a few years ago has become. The fast pace of changes also means that a different approach is required to assess the huge amount of data now available. A huge increase in DXCluster reports across all bands has been witnessed and it is a shame that many of the reports are of little value (the length of the alphanumeric string for location from MGM modes being a particular gripe). The increased complexity also means that ultimately some new tools need to be developed to handle the data along with a kind of mathematical model to assess daily predictions. I have been looking at Anaconda ultimately a Masters in Python will probably be needed.

This prompted me to start thinking about the wider issues arising from the COVID-19 restrictions and the realisation that the effect on weather and climate of the global lockdown is complex and requires a number of different climatological issues to be considered.

It is obvious there is a crossover between how COVID-19 has affected the weather, that is the short-term climatological influence, and the longer term effect on the Climate (deliberate use of capital letter to delineate climate from weather).

It is accepted that on a global scale industrial activity was reduced by around 35%, car travel reduced by around 50% and air travel by 75% in the first few months of 2020 as a by-product in the race to control the spread of COVID-19. It is estimated that carbon dioxide emissions dropped by around 17% compared to the same time period in the previous year.

These figures seem quite satisfying until one looks over the statistics and sees that in reality not much seems to have changed in the weather apart from much cleaner air resulting in considerbly less haze, but temperatures didn’t increase due to clearer deep blue skies.

The short-term climatological changes do not stem from simply the effects of less air traffic and the associated CO2 reduction. Effects from internal combustion engines (CO2 and NOx and numerous particulate emissions of different carbon densities), and industry (CO2 and SO2 gas, white sulphate aerosols and black carbon particulates) must also be considered. To what extent is difficult to assess as greehouse gases (CO2 and methane) and aerosols remain in the atmosphere for decades (or centuries). NOx, SO2 and black carbon tend to remain in the atmosphere for a few weeks.

Obviously the subject is of great interest to academia and there is no doubt we will see publications recounting some of their findings.

There will of course be no definitive answer but simply results from various mathematical models using multiple probability simulations (Monte-Carlo Method) will help improve understanding of the influences. It also provides academia with plenty of scope to debate the issues and politicians to prevaricate, literally while Rome burns.

Looking at the data so far it looks as if there was very little overall change in temperature. Regional variations of course will be found where local temperatures were either cooler or hotter depending on local particulate or SO2 emissions.

The effect on VHF/microwave tropospheric propagation from a radio amateurs perspective has been mostly neutral on a European scale.

What is not known is the medium term effect this has on the extreme weather cycles (Monsoons, Cyclones ( Typhoons and Hurricanes), or even extreme heat and rain).

I have been cogitating for some months over this issue and have become increasingly concerned over the increase in the record numbers of tropical storms and hurricanes on the Atlantic conveyor belt into Central America and the US eastern seaboard; the number of North Atlantic hurricanes/storms arriving in Europe, their frequency being hidden by the convention that storm names are given by the local meteorological agency rather than pan-European. One cannot, of course, ignore the increasing power and devastation caused by the number of typhoons sweeping across the Pacific into the Philippines, Vietnam, China and Japan. It was reported recently that Vietnam moved over 400,000 people to relative safety ahead of the latest system to sweep across their country.

This year, 2020, is also the first year, I think since 1851, that five Category 5 hurricances have swept into North and Central America in a single season.

Remember that a Category 5 Hurricane has a 1 minute sustained wind speed of 254 km/h (158 mph; 70 m/s)

We also need to consider the CO2 and particulate contributions from the wild fires in Australia, USA-West Coast, Argentina and of course the opportune fires in Brazil. A few years ago we also had concerns over the fires in Indonesia causing widespread air pollution across Asia, although those fires were eventually controlled by the introduction of Caterpillars, habitat devastation continues.

We must not forget either the increase in ice reduction in the Polar regions, unprecedented record temperatures in Sibera and the accompanying methane gas release

The cause of these natural events is well outside the scope of this note,but it is clear a change to the Earth’s climate is happening at an worringly exponential rate. We humans are not good at handling exponential events.

The famous EU directive on harmonisation of flush water amounts in toilets across Europe in response to Greta Thunberg’s Sixth Extinction address at the European Economic and Social Committee meeting in 2019 is a good illustration of the level of importance given to climate change matters at the political. Maybe politicians (and those in the finance industry) in Washington, London, Paris, or Bruxelles will have an enlightened moment when they find themselves choking from environmental concerns.

So that is the wider climate and political issue covered. It should be ringing alarm bells that something is happening.

Ionospheric Propagation 20201016

For the last few days I have been “lucky” enough to have noise levels on 18MHz drop enough to be able to listen to moderately weak signals.

To take full advantage I thought I would allow the Perseus to run with WSJT-x continuously in FT8. Signals could be copied down to about -20dBjt which is a ittle disappointing but at least it has provided some useful data.

I set out to capture enough data to help provide an insight into ionospheric propagation. With my simple equipment, extended computer based listening and a lot of patience a picture has emerged on double-hop propagation.

I chose 18Mhz because invariably it is my least noisy band (-90dBm in 2.7kHz). This last week it dropped to -106dBm/2.7kHz so for the first time in two years I have been able to hear slightly more distant (weaker) signals.

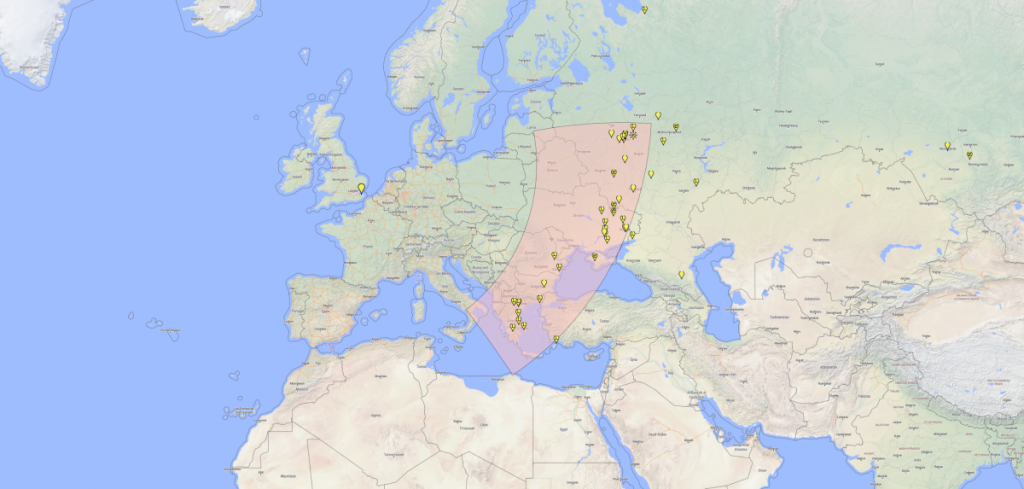
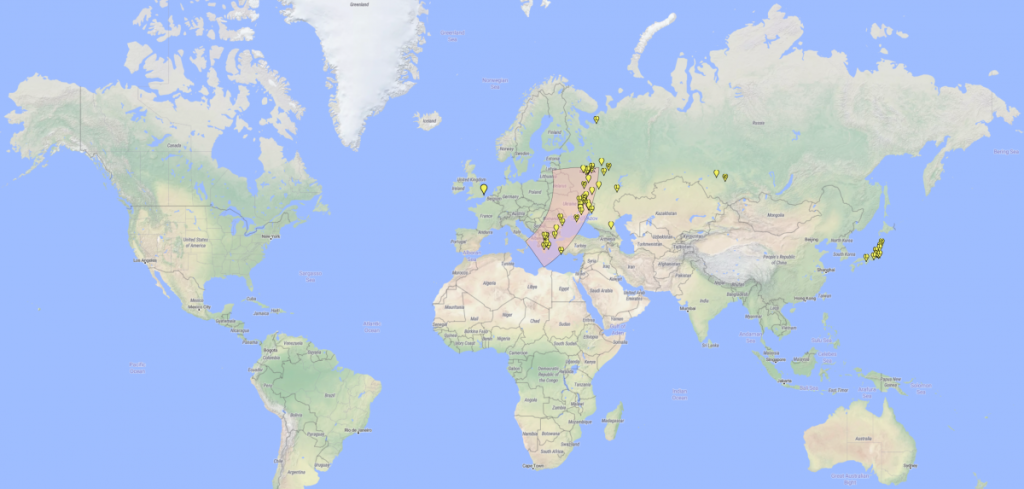
The current siting of the active loop (Welbrook 1530LNP) seems to provide coverage out to 2500km (Eastern England to Ukraine). The majority of signals are in a north-south arc centered on KN56 near Odessa.

18MHz coverage from south-east UK showing dominant first-hop path.

This is deliberately a myopic view to illustrate the first hop. As propagation improved in the first few hours after the band opened signals from Japan appeared.

18MHz world coverage on 20201016 UK early morning (up to about 08.00utc)

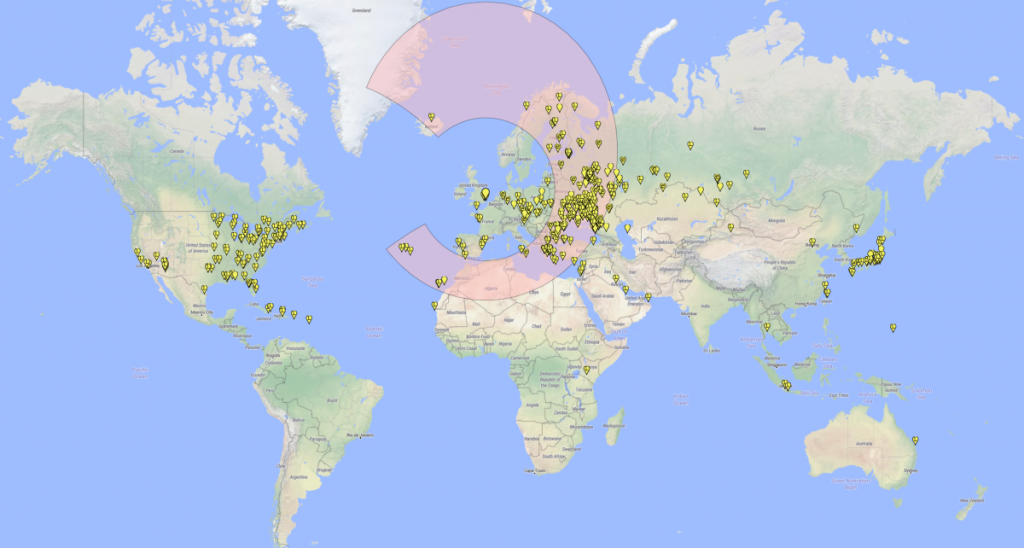
The best day for propagation was 14th October when by the end of the day stations had been logged from Japan/Guam/Australia in the est to Arizona/California in the west.

It was possible to hear stations in Japan at the same time as east coast US stations. As propagation changed Guam/Indonesia/Hong Kong could be heard at the same time as Arizona/California.

The full day coverage map lookes like this for ther 14th October:-

18MHz World coverage on 20201014 – band open to band close

Something quite fascinating becomes apparent when one is able to plot to such detail.

For a start these notes are not suggest the path to Japan is via central Ukraine. The data is showing activity and the pink region is the possible peak ionisation field. So the path to Japan remains through Finland, there just are not enough active stations in that part of the the world on the day I took the snapshot

Looking eastwards from the UK there is a peak at 2500km and then NOTHING until about 9500km.

Looking westwards there is a suggestion of a peak of activity at about 2500km giving coverage of the Azores and Iceland. Activity here reflects the population centres but shows an intruiging arc from the Caribbean Islands along the US East coast suggesting a peak at around 4500km. West coast Arizona/California peak is at 9600km.

These propagation rings would be more apparent if the station locations were plotted directly on a map using great circle projection.

It looks to me as if the main propagation mode for the Asian and US is emphatically not “double-hop” but the more natural chordal-hop, or trapped wave for if it were double-hop there would be station reports from 6000km or so much stronger than the weak scattered signals reported so far.

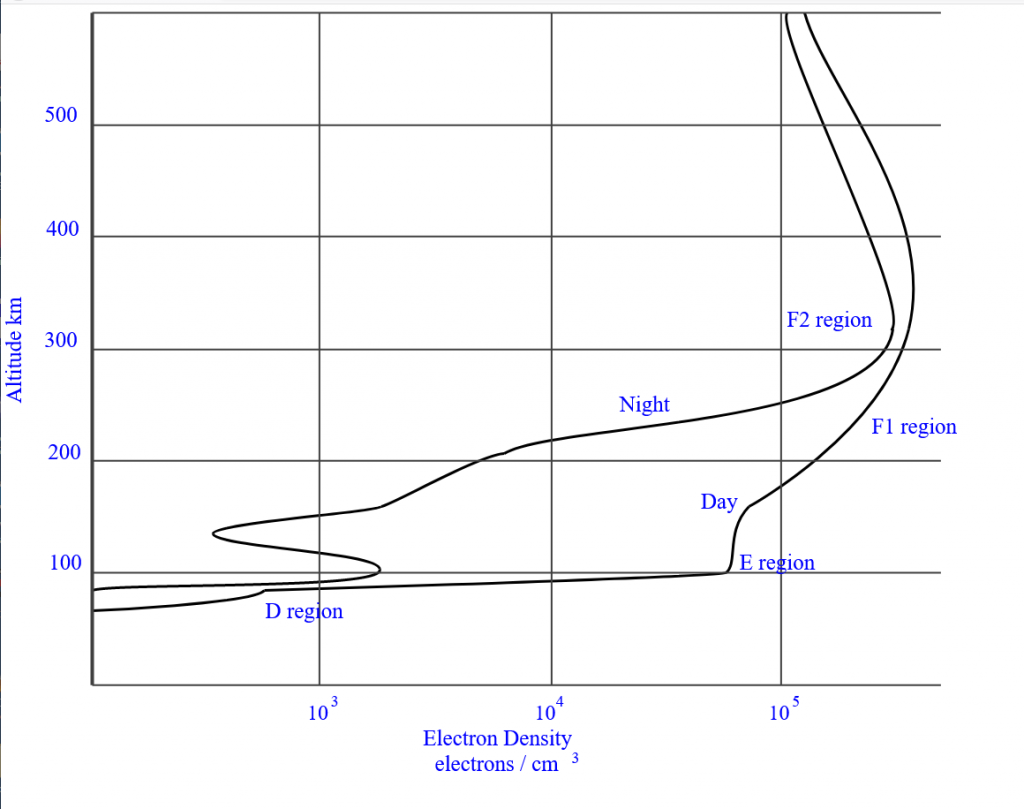
To keep things as simple as possible. Assume the ionised volume in the F2 layer is responsible so in the chart below we can probably expect peak refractivity between 250 – 300km altitude where the electron density nears (but is not quite) at its peak.

The picture below is a representation of the ionised layer boundaries and servers as an illustration only.

There are many sites providing near-realtime plots of ion density. As my main interest is the antipodian path to Oceania I favour the near-real tinme plots from Juliusruh in Northern Germany as that gives a guide as to what is happening over Finland and the Kola Peninsula. I am sure if i looked I would find data from Finland. If I do I can include it on my datasets.

Illustrative view of electron density in the ionosphere

Doing some sums a take-off angle of approximately 10 degrees is required to provide a single-hop out to about 2500km where peak refraction occurs at about 1250km at between 250-300km altitude. Very imprecise with its abouts and approximately but it serves to illustrate that it is a reasonable assumption.

Much weaker signals heard from Western Europe arise probably from backscatter caused by higher ionisation “clumps” or bubbles in the region boundary.

The F2 region is well known for its flatter profile compared to the F1 layer and this provides me with a clue about why signals from 9600km away (or further) can be received ar good signal levels (some Japanese stations measured 0dBft8 during 14th October 2020)

In tropospheric studies forward scatter from a refractive air mass is a well-known phenomenon. This can result in quite strong over-the-horizon scatter out ranges of 600km.

A similar forward scatter effect is noted where enhanced signals from aircraft are received from low grazing angle reflections.

It seems logical then to suggest that forward scatter is possible near the knee of the F2 region which would launch a strongly enhanced signal at a very low angle from 250km altitude. At some point this signal would encounter (perhaps near the day/night boundary) a step change in ionospheric density and be refracted again.

I haven’t done the sums yet but this descibes a sort of chordal-hop so 10,000km is not unreasonable. Antipodal propagation should also be possible (hence Guam/Australia could be via backscatter from the antipodal refractive region).

What would be of very great interest, as it would greatly enhance the understanding, is method to accurately measure the transit time for the digimode signals. Currently a dT is given in 100ms steps which makes is difficult to understand the path length.

My own PC has its clock controlled using the Meinberg application and time is within 0.005s. Agreed that with multi-tasking machines means that the timing of the transmitted elements is always non-varyingly accurate, but even a 50 or 10ms accuracy could be obtained.

A real-time clock controlled single use Arduino/RasPi could easily transmit and receive digimodes with better accuracy, enough for hf path measurements.

I lost the ability to do path measurements using Pactor II/III when I parted company with my SCS Pactor kit.

Modern GNSS receivers when put into Timing Mode can generate time interrupts at much better accuracy than the default Location Mode to clock each symbol in the transmission (including cw characters)

A final thought as I collect some more ideas together to research this topic.
This forward scatter (either from the E or F2-layer) could easily be responsible for anomalous 50MHz propagation. A particular case I have in mind is Europe to East-Coast USA during Es season. It is well known that PMSE clouds drift south during the longer summer days.

If one thinks of this as a banded region rather than discrete clouds forward scatter on the chordal path across the volume is very probable, and I would suggest highly likely.
Again an accurate determination of transmit and receive times would be required to uderstand the path length as would high quality data on PMSE zones/volumes

From my own perspective of course 50/70Mhz were good bands to hear the JW/JX beacons for extended periods during May/June. At 300okm distance and with very strong signal levels some form of forward scatter must be taking place.

Tools to assess microwave propagation

As you may have gleaned from the previous posts on this site, terrestrial propagation of microwaves relies on interactions with the lower atmosphere.

Propagation above 3GHz is very much affected by temperature, humidity, pressure and wind speed and a mechanism is required that pulls this information together for easy display and analysis.

The raw data is collected by radiosondes and via satellite based sensors and some of it is readily retrievable across the internet. Very quickly one can drown in the sea of data available.


In the late 1940s a way to present this data was adopted (Skew-T chart) that allowed relatively quick plotting of data to provide a view of lower troposphere activity for a particular site. Producing the same chart type for each radiosonde site allows a picture to be created for a particular region.
I rely on computers to pick up the raw data and create the data charts.
Meteorological satellite observations collect similar data in discrete grids (cubes) with a huge increase in data volumes.

The value of a Skew-T chart is in being able to very quickly identify height of temperature inversions, cloud base, cloud tops, probable precipitation type and freezing points.
All are necessary to evaluate the possibilty of ducting and scattering on propagation paths.

I found the following information on the internet that describes Skew-T charts and it derserves to be reproduced here, with a few small editing revisions.
I will add some notes outlining how I use such charts (and data) to make regular assessments. At this point I must point out that Skew-T charts are just one tool in a growing toolbox I use to assess atmospheric weather and how it affects propagation.
With the increased popularity of amateur radio digimodes with automated reporting gives access to huge amounts of indicative data on propagation paths on VHF/UHF and lower microwave bands. Band activity and digital modes on 9cm and upwards is much reduced. In either case I am looking at how to use this data to provide data on multi-plane refraction intensity.
We as amateurs also need to move our use of GPS data modes from location to timing so that better and more reliable measurement of propagation paths at VHF and above is possible.

Skew-T charts

Before I start the discussion on Skew-T charts it essential you have some idea of how pressure varies with height. I have produced a simple table listing pressure with height in the average atmosphere along with a comment on key events. These events will be expounded in further posts discussing propagation.

Key points to bear in mind:

Surface Ducts have a ceiling of around 1000m, Frequent seurface ducts will be observed at a height of around 500m.
Elevated ducts and weather based scattering in the western part of Europe up to about 4km.
Rain scatter can happen up to about 8km.
Thunderstorms can affect up to about 14km.

hPAkmComments
10015.750 
20011.750 
25010.000 
3009.250 
3508.000Temperature inversion
4007.250 
4506.250 
5005.500 
5504.750 
6004.250Temperature Inversion
6503.500Dew Point 
7003.000 
7502.500 
8002.000 
8501.450 
9001.000Anomalous Region
9500.475 
10000.100 

How To Read Skew-T Charts

Skew-T charts are useful for quickly and accurately viewing the structure of the atmosphere all the way from the surface to 100,000 feet.

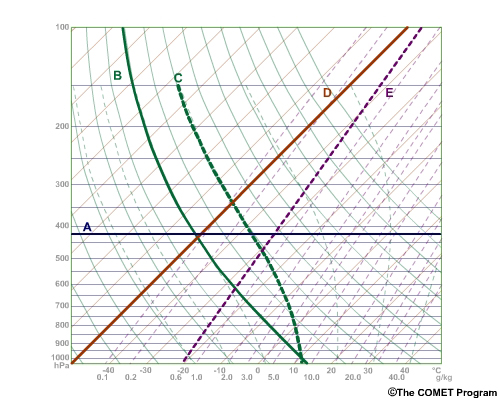
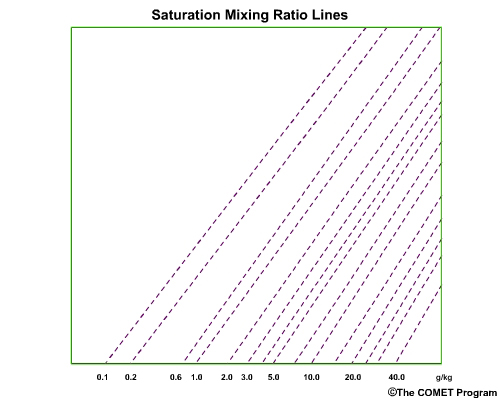
Skew-T charts are most commonly used to plot parameters measured by radiosondes as they rise throughout the atmosphere. They only plot three measurements: temperature, dew point, and wind velocity (the speed AND direction of the wind). Additionally, there are 5 lines on a Skew-T: isotherms, isobars, dry adiabats, moist adiabats, and saturation mixing ratio lines.

COMET Program
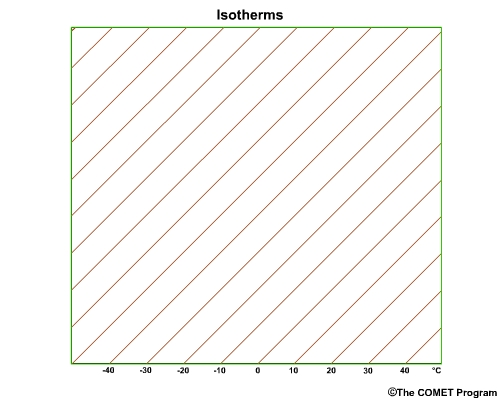
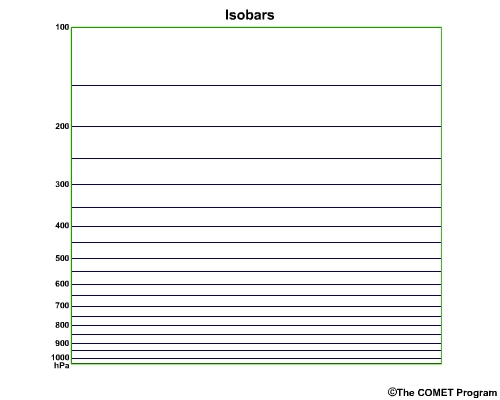
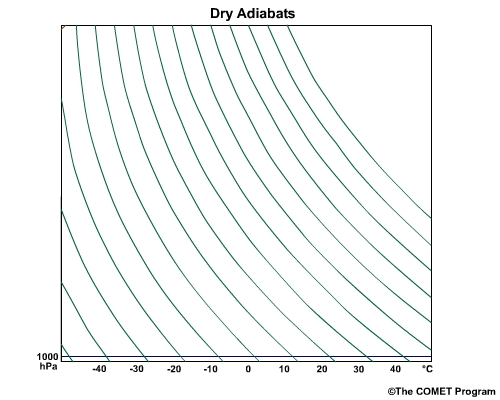
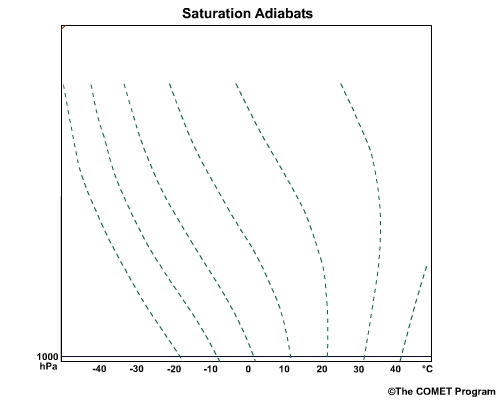
Isobars (A), dry adiabats (B), moist adiabats (C), isotherms (D), and saturation mixing ratio lines.

Besides simply acting as a template to plot the temperature, dewpoint, and wind, Skew-T charts are useful for easily finding the locations and values of important levels and parameters of the atmosphere. CAPE, the LCL, and the LFC are just a few things that can easily be found on a Skew-T chart.

Description of each line grouping on a Skew-T chart.

Isotherms

Credit: UCAR Comet Program Skew-T module

Isotherms are lines of constant temperature. They are the namesake of the Skew-T chart because they are skewed 45 degrees to the right. Skewing the Ts may seem a little unintuitive, but a Skew-T allows us to easily calculate important atmospheric levels and parameters like the Lifting Condensation Level (LCL), Level of Free Convection (LFC), the Equilibrium Level, and CAPE. A Stüve is like a Skew-T but without the skewed temperature lines. It is not as useful for most meteorological applications because the adiabats on it are not curved, meaning we can’t accurately calculate the things listed above.

Isobars

Credit: UCAR Comet Program Skew-T module

Isobars are defined as “lines of constant pressure.” On a Skew-T chart, pressure, NOT height, is plotted on the y-axis, so isobars are simply parallel to the x-axis. Because pressure decreases more slowly with height the higher you go, pressure is plotted in a logarithmic fashion on Skew-T charts. For this reason, Skew-T charts are also commonly called Skew-T/Log-P charts. If we didn’t plot pressure in logarithms, the Skew-T charts would be as high as the weather balloons they plot traveled – approximately 100,000 feet high!

Dry Adiabats

Credit: UCAR Comet Program Skew-T module

Adiabatic processes are processes in which no heat is exchanged with the outside system (in our case, the atmosphere), and dry adiabats show how much an unsaturated parcel cools when lifted through the atmosphere. You are probably thinking “how can a parcel cool and maintain the same heat content?” Well, keep in mind that as an air parcel rises, it expands due to the surrounding atmosphere exerting less pressure on it, so the total heat content remains the same.

Adiabatic processes are a consequence of the First Law of Thermodynamics, which states that the heat added to a certain mass of a gas is equal to its change in internal energy + the work done BY the gas ON the environment. My doing some nifty mathematical maneuvering and applying the ideal gas law, we find that the first law states that changes in temperature are positively correlated with changes in pressure. I’ll discuss this and more in a tutorial in the future, but the important thing to know is that when an unsaturated air parcel rises and ANY air parcel sinks, it will travel parallel to these adiabats.

These adiabats follow the “Dry Adiabatic Lapse Rate,” which is approximately 10 degrees Celsius per kilometer.

Moist Adiabats

Credit: UCAR Comet Program Skew-T module

When saturated air rises, it follows the “saturation” or “moist adiabats.” When air reaches saturation, gaseous water vapor condenses into liquid water droplets, and this phase change releases “latent heat” into the atmosphere. Because of this, the moist adiabatic lapse rate is ALWAYS less than the dry adiabatic lapse rate, but as you can see above, moist adiabats are NOT parallel and vary quite a bit with both temperature AND altitude.

The most important thing to remember about moist adiabats is that a saturated air parcel will ONLY follow them if it is rising. If the parcel is sinking, it is warming away from saturation and will follow the dry adiabats.

Saturation Mixing Ratio Lines

Credit: UCAR Comet Program Skew-T module

The saturation mixing ratio is the ratio, in grams of water vapor per kilogram of air, that an air parcel must have at a given pressure and temperature to be considered “saturated.” Once an air parcel is saturated, it generally cannot hold any more water vapor.

Now that you know the lines – let’s find out how we can use them to calculate some particularly important levels of the atmosphere. We’ll learn how to calculate the lifting condensation level (LCL), the convective condensation level (CCL), the level of free convection (LFC), and the equilibrium level (EL), as well as convective available potential energy (CAPE) and convective inhibition (CIN).

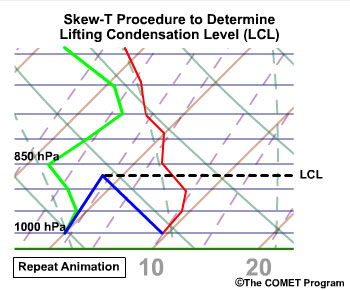
Lifting Condensation Level (LCL)

Lifting Condensation Level
Credit: UCAR MetEd COMET Program

The LCL is the pressure level an air parcel would need to be raised (dry adiabatically) to to become saturated. To find the LCL, follow a dry adiabat from your surface environmental temperature and a saturation mixing ratio line from your surface dewpoint temperature. The intersection of these marks the location of the LCL. The LCL is important because it marks location where the air parcel stops rising at the dry adiabatic lapse rate and switches to the moist adiabatic lapse rate.

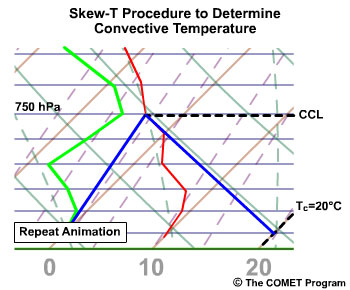
Convective Condensation Level (CCL)

Convective Condensation Level

The Convective Temperature (Tc) can be found by taking a dry adiabat down from the CCL to the surface.

A closely related level is the Convective Condensation Level, or CCL. The CCL is the pressure level that a parcel, if heated to the “convective temperature,” would freely rise and form a cumulus cloud. The convective temperature is the temperature the surface must reach so that air can freely rise, and the CCL is at the intersection of the environmental temperature (NOT a dry adiabat from the surface… that’s the LCL) and the saturation mixing ratio line from the surface dewpoint temperature.

Notes: The LCL and CCL are useful for determining the height of cloud bases. For non-convective clouds that are forced to rise, the LCL is a good approximation. On the other hand, the CCL is a better estimate for clouds formed by convection, like cumulus clouds. In reality, cloud bases are generally somewhere between the LCL and CCL.

The reason why thunderstorms in the desert often have high bases is because surface dewpoints are low there, causing the LCL and CCL to be high in the atmosphere. Conversely, thunderstorms in humid locations generally have lower bases because the LCL is lower.

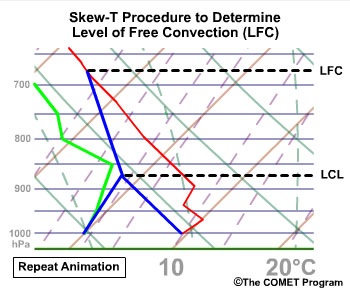
Level of Free Convection (LFC)

Level of free convection.

It is calculated by taking a moist adiabat from the LCL until you intersect the environmental temperature.

The LFC is the pressure level an air parcel would need to be raised so that its temperature is equal with the environmental temperature. It is found by taking the moist adiabat from the LCL until it intersects the environmental temperature. After this, the air parcel is warmer than its environment and can freely rise (hence the name – level of free convection).

There are a few isolated situations where this approach won’t work – for example, if the surface has reached the “convective temperature” mentioned above, the LFC is at the surface. But for the vast majority of situations, this method works beautifully.

Not all soundings have an LFC. If the moist adiabat never intersects the environmental temperature because the atmosphere is relatively stable and does not exhibit a sharp decrease in temperature with height, there is no LFC. Additionally, many places that have an LFC during the day may not have one at night, when the surface is cooler and the atmosphere is more stable.

Equilibrium Level (EL)

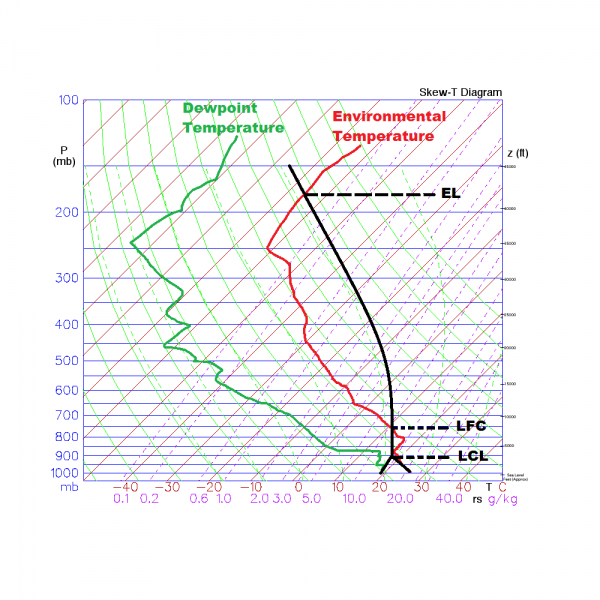
A Sample Skew-T Diagram.
The slanted red lines are lines of constant temperature, the dotted purple lines are lines of constant mixing ratio, the solid curved green lines are dry adiabats, and the curved green lines are moist adiabats

The Lifting Condensation Level (LCL), Level of Free Convection (LFC), and Equilibrium Level (EL) are labeled. The CAPE is bounded on the bottom by the LFC and the top by the EL and is the total area between the black line (path of the air parcel) and red line (environmental temperature).

The equilibrium level only exists if there is an LFC, and it is defined as the level at which the moist adiabat denoting the parcel’s path recrosses the environmental temperature. At the EL, the air parcel is the same temperature as its environment, and above it, it is cooler and more dense. The EL can be found by looking at the “anvils” on thunderstorms, as these mark the location where a rising air parcel is no longer positively buoyant. The “overshooting top” of a thunderstorm exceeds the equilibrium level, but this is only because the momentum of the storm’s uber-powerful updraft is allowing it to reach a higher altitude, NOT because the air above the equilibrium level is positively buoyant.

Convective Available Potential Energy (CAPE) and Convective Inhibition (CIN)

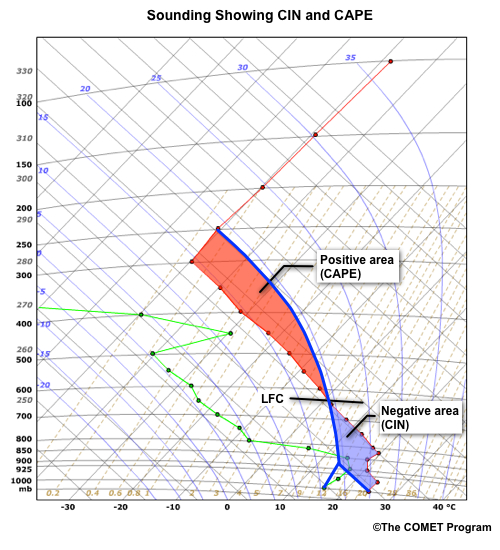
Sounding showing CIN and CAPE
Credit: UCAR

CAPE is the area bounded by the environmental temperature and the temperature of a parcel as it rises along the moist adiabatic lapse rate. By definition, the lower bound of the CAPE is the LFC, and the upper bound is the EL. Because CAPE measures how buoyant an air parcel is relative to its environment, it can be used to estimate the maximum strength of updrafts in a storm, and by association, how severe a storm can become. If you want big storms, you need big CAPE. Period.

CIN is CAPE’s antithesis: while CAPE measures positive buoyancy and the strength of convection possible, CIN measures negative buoyancy and the resistance to convection. CIN is bounded by the environmental temperature on the right and the temperature of the rising parcel on the right, and is measured from the LFC down to wherever the temperature of the environment and temperature of the parcel are the same, which is almost always the surface. In this area, the temperature of the parcel is less than the environment, thus rendering the parcel more dense and causing it to sink in the absence of any external forcing. CIN generally peaks during the early morning and decreases during the day as the sun heats the surface.

CIN is actually a necessary ingredient for severe storms because it allows CAPE to build to tremendous levels by preventing convection and mixing of the atmosphere during the morning hours. When heating from the surface finally erodes the CIN, CAPE values have grown astronomically large and any storm development is explosive, leading to powerful supercells with large hail, damaging winds, and tornadoes.

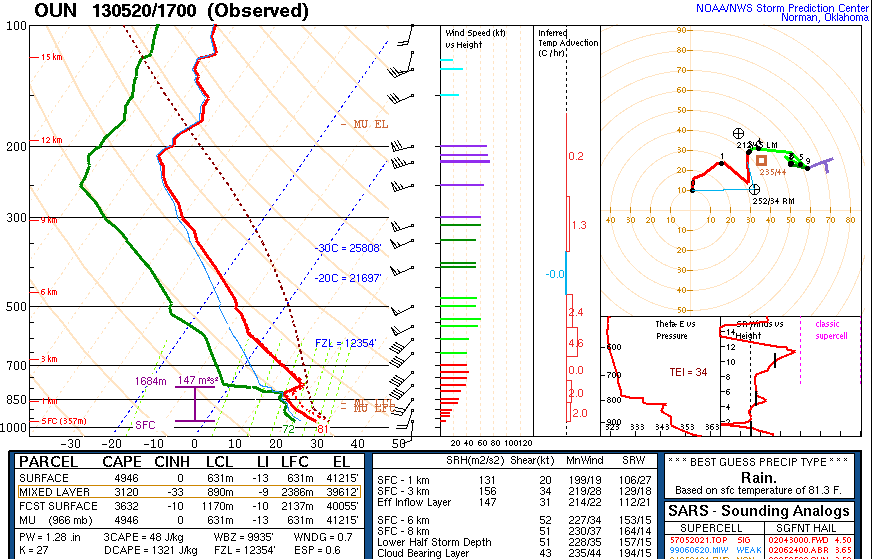
Here’s a classic severe weather sounding from Oklahoma City that was taken 3 hours before the devastating 2013 Moore, OK EF-5 tornado. See if you can find the LCL, CCL, LFC, EL, CAPE, and CIN on this sounding!

A classic severe weather sounding, with a pronounced “capping inversion” (CIN) that keeps convection from gradually occurring throughout the day, allowing it to explode all at once in the late afternoon/evening hours when the cap breaks. There is also a ton of CAPE and strong wind shear throughout the atmosphere. The 2013 Moore EF-5 tornado touched down 3 hours after this sounding was taken.

Using Skew-T Plots

As the radiosonde balloons ascends, it records the temperature and relative humidity at certain prescribed pressure levels (called the mandatory levels) and anytime a significant change occurs in the temperature, humidity, or wind.

Typically, a radiosonde observation is complete when the balloon, carrying the radiosonde, bursts and begins to descend. At that time the data is compiled into a series of five-digit groupings containing temperature, dew point depression and wind speed/direction for mandatory and significant levels. This data is plotted onto a skew-T.

The five-digit coded radiosonde observation is complicated to decode and plot onto a Skew-T diagram. As such, there are several private weather vendors and universities who have written programs to decode and plot (or redisplay the info in a tabular format) these observations. A simple Internet search for “atmospheric soundings” will provide you with several choices.

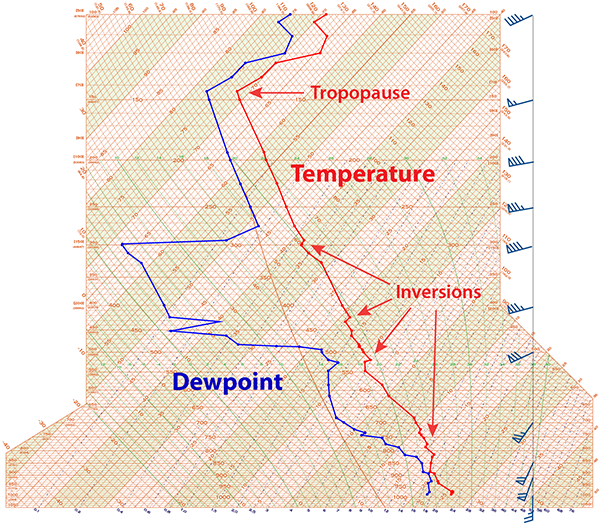
There are two basic lines plotted on a Skew-T from which we can derived much information. These represent the dew point which is calculated from the relative humidity (in blue, left line) and air temperature (in red, right line).

Skew-T plot of the 7:00 pm radiosonde sounding from Birmingham, Ala. on the evening of April 27, 2011, the day of the Tuscaloosa-Birmingham EF-4 Tornado.

While it is generally true that the air temperature decreases with height, it is readily seen that this decrease is not uniform nor is it consistent. There may be several places where the air temperature remains the same or increases with height. These particular places are called ‘temperature inversions’ where the normal temperature decrease is ‘inverted’ and the temperature will increase with height.

Another common characteristic of radiosonde soundings is the location of the tropopause. The tropopause is the boundary between the troposphere and stratosphere and is also indicated by a large temperature inversion.

The dew point line will be the most ‘wiggly’ as the radiosonde ascends through intervening pockets of moist and dry air. At each level on the Skew-T, the closer the dew point is to the temperature, the higher the relative humidity is at that level. The dew point will occasionally equal the air temperature and will be seen by the intersection of both lines.

The other piece of information plotted on a Skew-T is the wind speed and direction. This info obtained as the radiosonde is tracked using GPS during its ascent. The wind speed and direction is reported for the same mandatory pressure levels with additional required elevations above sea level and for any significant changes in speed or direction.

Skew-T Examples

Radiosonde observations provide the condition of the atmosphere above the launch site (typically within 25 miles/40 km) at the time of launch. While they do not provide any direct forecast information, they do help explain why we experience different types of weather. Following sample soundings are typical for different weather conditions.

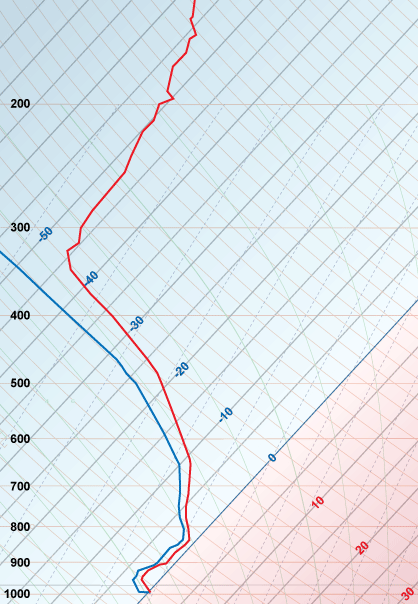
Snow

The atmosphere is very moist as indicated by the small amount of separation between the air temperature (red line) and the dew point (blue line). Even though the air temperature increases a few hundred feet above the ground (a temperature inversion) the air temperature, throughout the entire atmosphere, remains below freezing.

So, when precipitation begins, it will be in the form of snow and will remain frozen as snowflakes reaching the ground.

A typical “Snow” sounding.

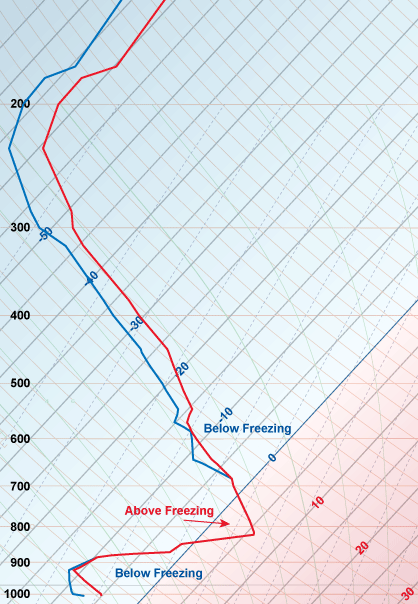
Ice pellets (Sleet)

As with the previous sounding, the atmosphere is very moist. So much so, the air temperature and dew point are the same from near 900 millibars (3,000 ft. / 1,000 m) to a little above 700 millibars (10,000 ft. / 3,000 m).

At the surface, an arctic cold front had moved south of the observation station with an air temperature well below freezing. The air temperature begins to decrease with height (which is normal) dropping from 23°F to 12°F (-5°C to -11°C).

However, the density of the arctic air is such that it lays close to the ground with its vertical extent fairly small, in this case only about 3,000 feet (1,000 meters) deep. Above 900 millibars (3,000 ft. / 1,000 m) the air becomes considerably warmer. This area is called an inversion, where temperature change with height is ‘inverted’ as it increases with height instead of typically decreasing with height. This inversion is often also referred as a ‘warm nose’.

Eventually, the temperature of the atmosphere will return to the typical decrease with height (near 800 mb) and will continue to cool until it falls to below freezing again (about 720 mb).

While there may be some precipitation forming as rain in the warm ‘nose’ region where the air temperature is above freezing, the vast majority of precipitation will form as snow in the colder below freezing air above the inversion.

As snow falls into the ‘warm nose’, it melts into a liquid drop/rain. Then the liquid drops fall back into the arctic air mass (near the ground) that is cold enough and deep enough for the liquid to freeze into ice pellets before reaching the ground.

A typical “Sleet” sounding.

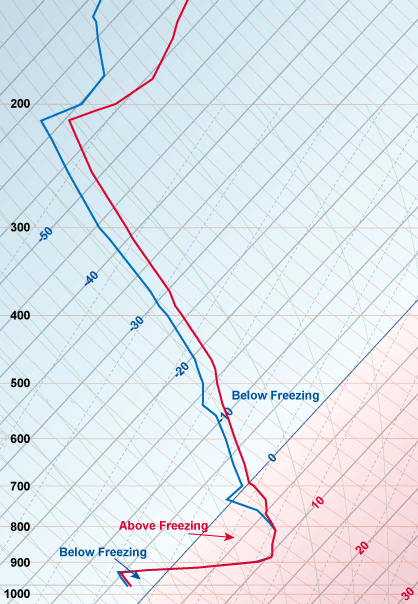
Freezing Rain

The basic pattern for freezing rain is similar to ice pellets. The main difference is the sub-freezing air near the surface is very shallow and/or ‘warm nose’ is large. In the end, the melted snow does not have sufficient time to freeze into ice pellets before it reaches the ground.

Therefore, precipitation falls as rain but freezes upon contact with an elevated surface such as a tree, power line, automobile or bridge.

These elevated surfaces may be capable of accumulating ice as soon as the air temperature falls below 32°F (0°C). For road surfaces in contact with the ground, they usually begin to ice when the air temperature falls to 28°F (-2°C).

Of all winter weather situations, freezing rain causes the most havoc. There are more car accidents, injuries and deaths from freezing rain than in any other type of winter weather.

A typical “Freezing Rain” sounding.

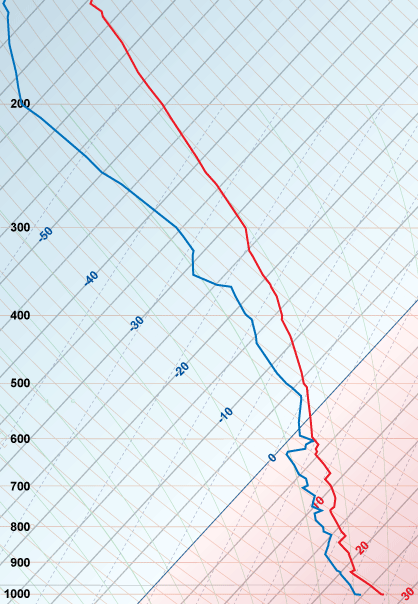
Hurricane

Inside hurricanes, the velocity of the air helps keep the air mixed. Therefore, other than the normal decrease with height, variations in temperature (and dew point) are fairly minimal.

A typical “Tropical Storm/Hurricane” sounding.

Thanks to Charlie Phillips at Weather 101charlie.weathertogether.net.

References:

  1. National Weather Service (n.d.). Skew-T Log-P Diagrams. Retrieved May 10, 2017, from http://www.srh.noaa.gov/jetstream/upperair/skewt.html
  2. University Corporation for Atmospheric Research (n.d.). Skew-T Mastery. Retrieved May 17, 2017, from http://www.meted.ucar.edu/mesoprim/skewt/
  3. Ladd, R. (2014, April 25). The Basics of a severe weather sounding. Retrieved May 17, 2017, from http://wx4cast.blogspot.com/2014/04/the-basics-of-severe-weather-sounding.html

Illustrations of real weather in Europe

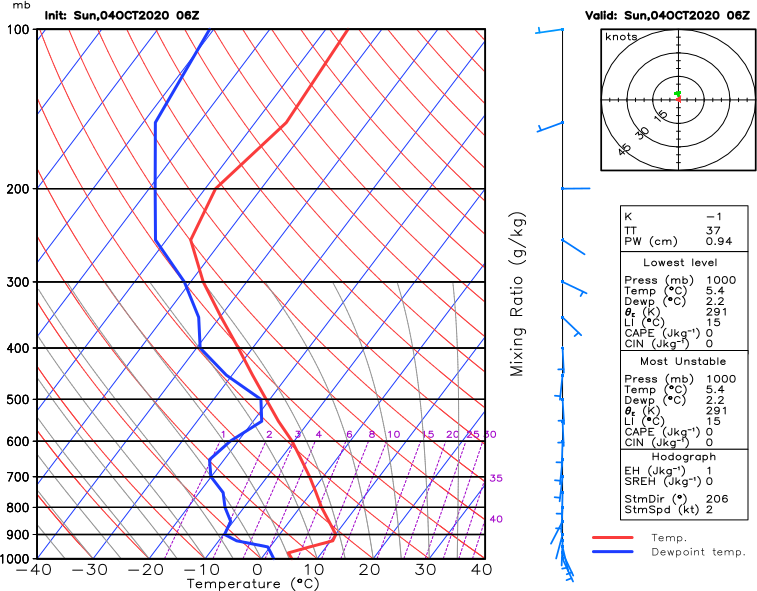
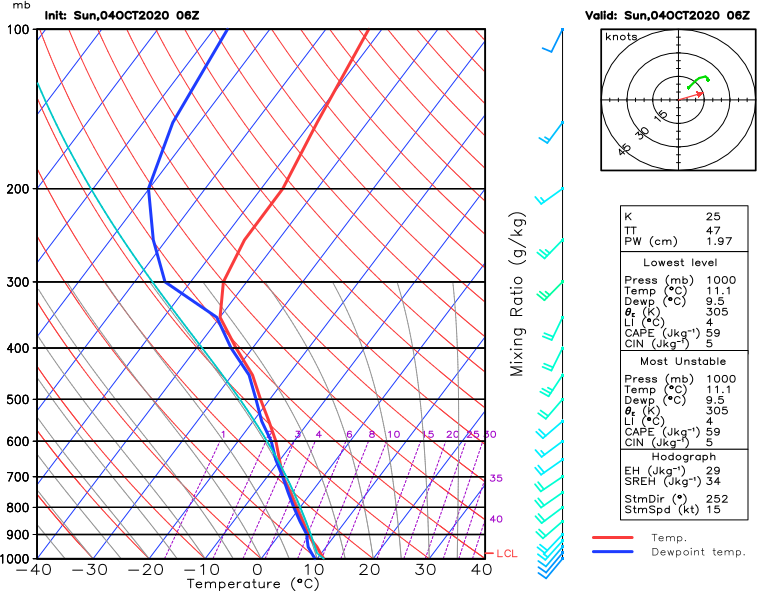
A couple of Skew-T charts to show the atmosphere on 4th October 2020.
The first is from Tromsoe, the most northerly sounding I retrieve. Usually I use it as the basis for my baseline atmosphere as it usually varies little.
Today though a surface duct has formed so makes the plot newsworthy

Tromsoe – 20201004-0600utc

The second chart is from the same time for Luxembourg.
It shows cloud from about 500 to 8km asl.
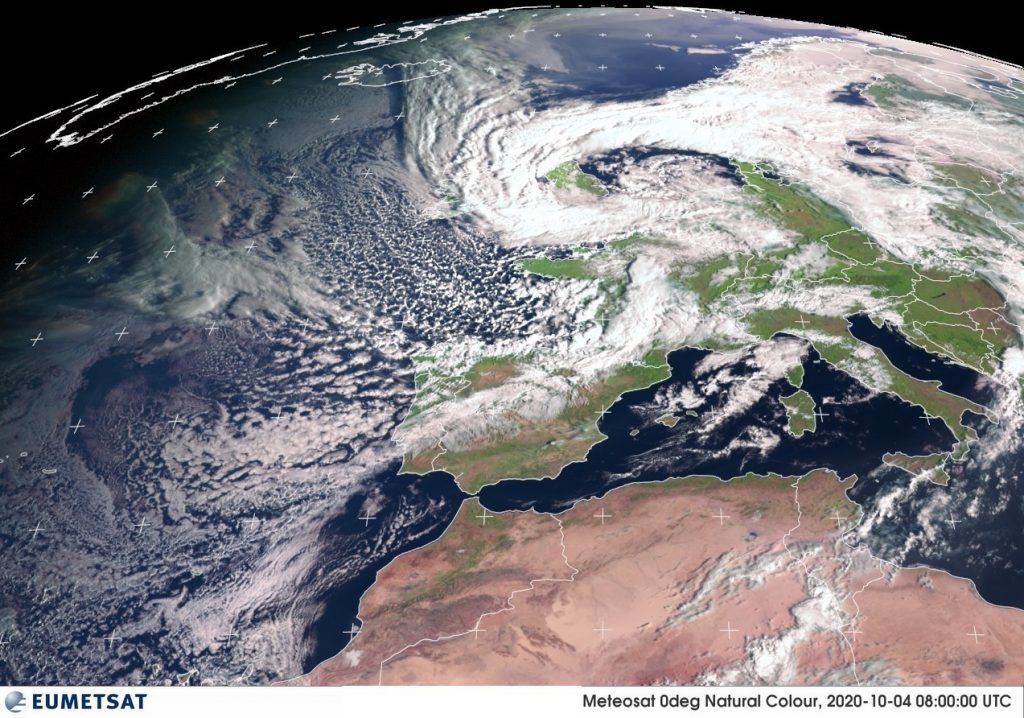
This is the heart of the very active Low pressure system that spanned western Europe from 3rd-5th October 2020

Luxembourg-20201004-0600ut

For reference here is the Enhanced RGB satellite image a little later

Revised Site – 20201004

This is simply a marker note that points to the day when I finished making revisions to the server backend and reached the stage where safer and more secure publication is possible.

Currently Storm Alex (20201003) and its siblings (as below) preclude raising the dish to take a look at conditions on 3cm so I took the opportunity to alow the work on this site to bubble to the top of the list.

3cm Propagation 20200422

I woke with a compulsion to take a look at 3cm overnight. Unfortunately at 01.00 local time not even I am not at my best mentally so it took a while to figure out what I was seeing. I still do not know whatI saw to be honest.

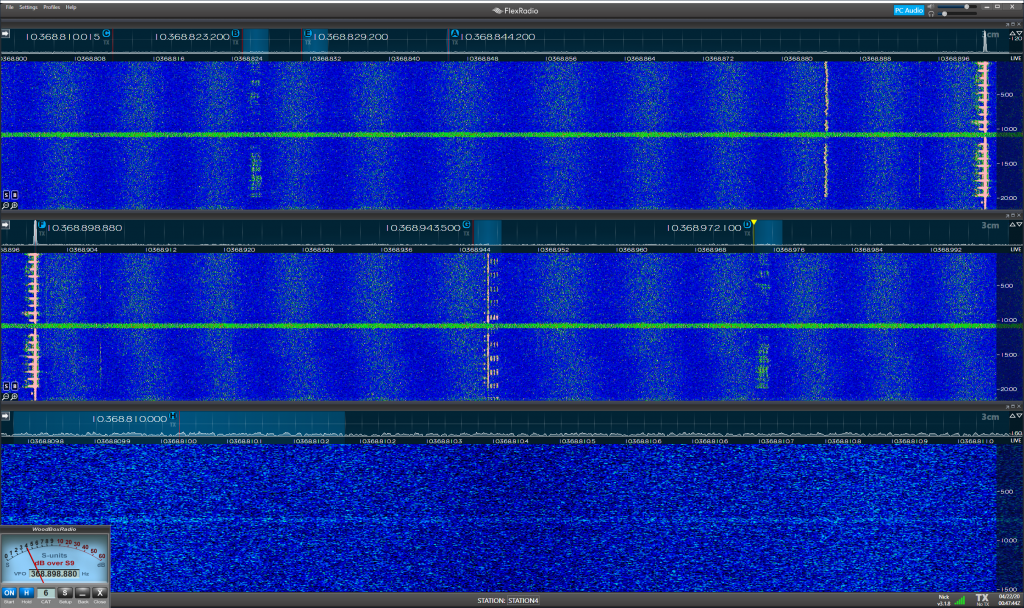
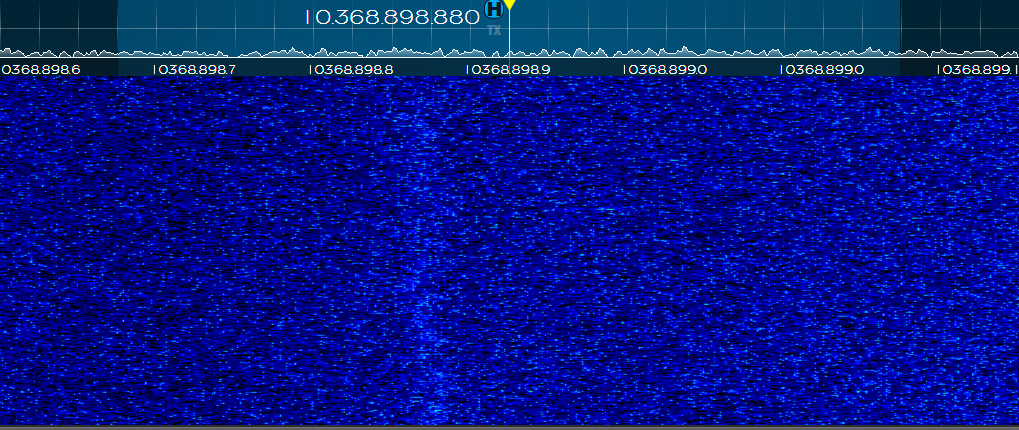
The 3cm beacon band 22nd April 2020 0047utc

This shows a few features worthy of note. The dish was point at PI7ALK so it’s signal on 10368.898.880 is a good and strong with some slow fading. This qsb qas to be my undoing.

GB3PKT was also strong pn the same heading at -13dBjt, and the other regular visitor, PI7RTD was also the nest signal I have seen from it for a long while.

What is odd and it may not be clear on this image, there are three additional beacons. The first on 10368.824.000 (MGM), second one on 10368.904.000 (cw only) and a third on (about) 10368.972.500 (MGM).

My comprehensive listings fail to show any beacons on those frequencies. I think the MGM beacons are JT4G rather than PI4 but that doesn’t help.

There is also a smudge, if you look carefully with one eye closed and eyes screwed up tight whilst hanging from the ceiling…..so it is by no means certain that there is a signal on 10368.810.100.

As I thought the signal might have been SK6YH/B from Goteborg I moved the dish in that direction fully expecting to see an increase in signal amplitude.

Sadly it was not to be and by the time I finished thoroughly checking headings (azimith and elevation) by the time I set the dish back on PI7ALK all three additional beacons had disappeared with PI7ALK rapidly disappearing. It was as if the green curtain was being drawn to hide the Wizard.

By 0100utc the band was back to its neutral state. Even GB3PKT had dropped back to -16dBjt. No other signals, not even PI7ALK were audible/visible.

Obviously I caught the back end of an enhanced propagation event bu have been left frustrated (for now) as to the identity of those unidentfied beacons.

As I write this at 0730utc the band it quiet, as quiet as it was after 0100utc. Wave height in the southern North Sea remains at about 2m so there is no prospect of evaporation ducting. There is a troposcatter signal from PI7ALK so at least I know the system is working

Troposcatter from PI7ALK 0700utc 22 April 2020
Fog sensor showing slightly increased levels across the North Sea – source: Eumetsat

Given the location of the thicker band it may be possible to see something from DB0GHZ although unlikely as the layer would have have an altitude of about 4km for the scatterpoint to be above the horizon. As the huge change in Dew point temperature for Helgoland occurs at about 650hPa (~3500m asl), this places the altitude at which scattering could take place below my horizon.

Hold the Front Page – Nothing is happening*! 20200421 0600utc

A slightly later post as I am still repairing my chair after falling out of it.

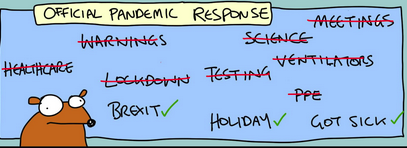
First Dog on the Moon is fast becoming the go topl;ace for all the news and views on World affairs. Well, not really but he does show how barking mad many of our politicians see to be and the rest worship at the alter of Mammon. We need a change and we need to change.

UK Government response to the COVID-19 pandemic – only thing missing is Dilyn ate my manuscript(s)

Checking the 3cm band this morning just before sunrise and I was surprised at the absence of signals. Only GB3PKT was present, much stronger than usual when pointing towards PI7ALK. Nothing else, nada, rien, gar nichts.

Not even anything from GB3LEX, F5ZTR or ON beacons. Zilch, nix. That is the wonder of having very few aircraft flying about.

Checking the wave height in the North Sea showed that it is around 2m across the main body of water, less nearer the coast and of course zero after the waves break onto the shore. We can be confident then that an evaporation duct is unlikely to exist across the the European mainland.

PI7ALK was a very strong signal s7 or so and quite stable until about 2200utc where it started to become much less stable, fade out seems to have been complete by about 2300utc. This is supported by the signal history of GB3PKT which shadowed that of the Alkmaar beacon. Minimum signal appeares to have been reached at around 22.00utc (-18dBjt) but recovered at 0054utc (-14dBjt)

The signal from GB3PKT is affected by coastal and tidal effects, an investigation I was hoping to conduct by comparing signals with GB3MHZ. Sadly the Martlesham beacon is showing a reluctance to radiate a signal. A short time ago I could hear it, sometimes direct, and more often from wind turbine scatter. The last ten days or so I have heard/seen nothing from it. Maybe it too has gone into self-isolation, hidden itself from the public. Maybe sometime in the near future a baby beacon will appear.

Back to radio… No signals from the usual beacons. Looking closely at the waterfall I see nothing via troposcatter either, no weak smudges, even at different small increments of elevation. It is at this point the usual first move is to check that the system is working. The pigeon sitting on the feed tells me that all seems to be normal as the noise level increased when it sat there and reduced when I persuaded it to fly away.

It is at this point I toss in the throw away line “beautiful sunrise this morning, incredibly clear air. Really crisp and clean with little or no haze.”

I could go on but therein lies the clue to the fact that there are no signals to be heard. Clear air….little haze…

Water vapour content is low and this is confirmed by looking at the Eumetsat Fog sensor image. It clearly shows a widespread lack across the UK and near European mainland and therefore troposcatter will be very weak or nonexistent.

Eumetsat Fog Sensor 20200421 0600utc – suggesting low wvc

There you have it. An interesting start to the day as it serves as a reminder that signal monitoring at microwaves has a number of surprises. Nature sends a little message as a reminder that it is all well to pontificate on reflection geometries, wave heights, refraction indices and so on. Ultimately she is in charge and will determine the course of the investigations. I need to find reliable measurements of WVC , or humidty (humility?). These figures may be available in the dataset from Eumetsat/AVIS. A clue may also be in the Skew-T charts that show sharp and deep changes to Dew point tempertaures for Helgoland, Brussels, Essen, Frankfurt, London and Manchester. Typically -30 (or -40 deg C) at 600hPa (approx 4000m)

Just look at the orange peel like cloud formation over France at 0700utc.Wow, just wow.

Orange peel cloud formation over France – 20200221 070utc

Note:

* unfortunately this applies to the UK Government’s actions to manage the COVID-19 pandemic. The UK Government has gone to great lengths to demonstrate that nothing is too much trouble. I salute our medical and frontline workers for their tireless devotion to our wellbeing.

Apropo of nothing just a decent image

Eumetsat image at 0800utc 20200420

What this image does not show is how much the wind has increased since the pre-dawn calm. The reason for the wind increase is implied from the image though as the storm system over France starts to influence weather in south-east England. To minimise wind loading I have set the dish to point at F5ZTR on 3cm and can see a weak but continuous signal from this beacon.

At 191km distant it is close to the theoretical trans-horizon limit from here.

F5ZTR on 3cm