For the last few days I have been “lucky” enough to have noise levels on 18MHz drop enough to be able to listen to moderately weak signals.
To take full advantage I thought I would allow the Perseus to run with WSJT-x continuously in FT8. Signals could be copied down to about -20dBjt which is a ittle disappointing but at least it has provided some useful data.
I set out to capture enough data to help provide an insight into ionospheric propagation. With my simple equipment, extended computer based listening and a lot of patience a picture has emerged on double-hop propagation.
I chose 18Mhz because invariably it is my least noisy band (-90dBm in 2.7kHz). This last week it dropped to -106dBm/2.7kHz so for the first time in two years I have been able to hear slightly more distant (weaker) signals.
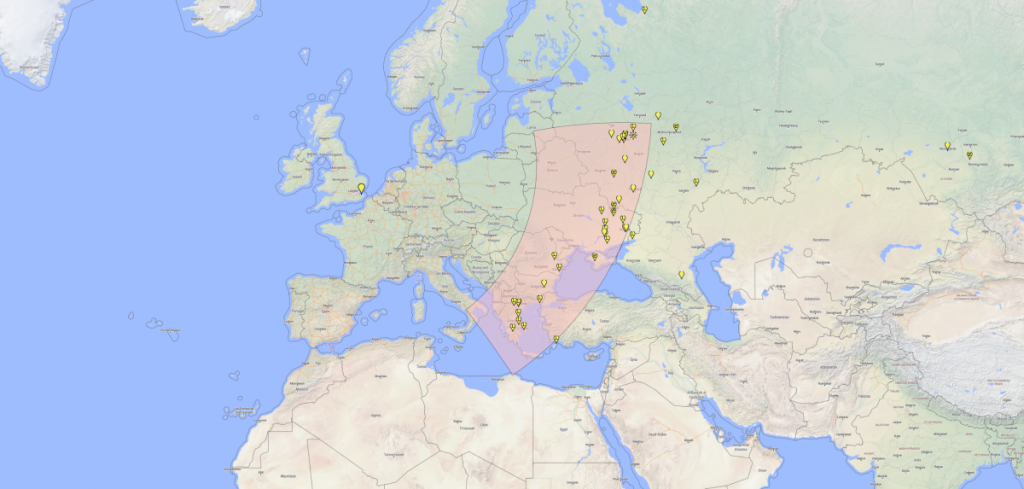
The current siting of the active loop (Welbrook 1530LNP) seems to provide coverage out to 2500km (Eastern England to Ukraine). The majority of signals are in a north-south arc centered on KN56 near Odessa.

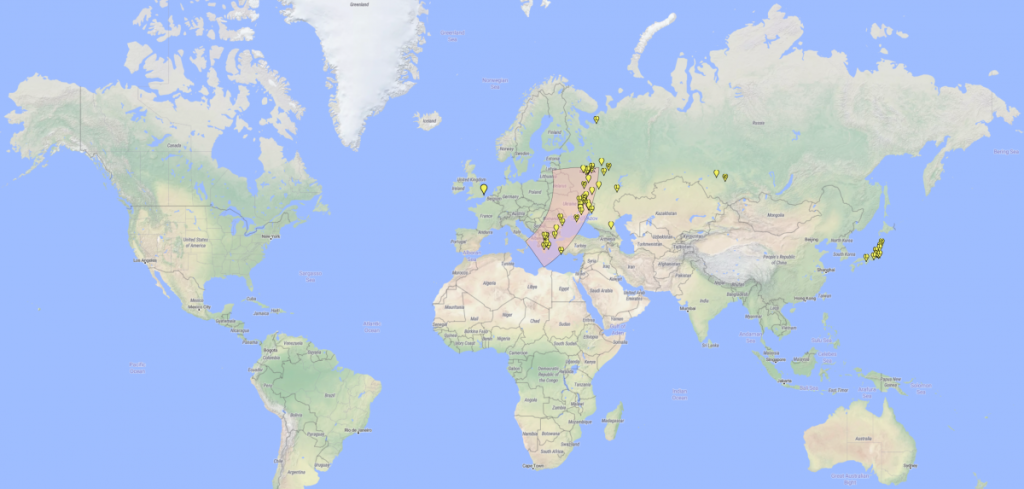
This is deliberately a myopic view to illustrate the first hop. As propagation improved in the first few hours after the band opened signals from Japan appeared.

The best day for propagation was 14th October when by the end of the day stations had been logged from Japan/Guam/Australia in the est to Arizona/California in the west.
It was possible to hear stations in Japan at the same time as east coast US stations. As propagation changed Guam/Indonesia/Hong Kong could be heard at the same time as Arizona/California.
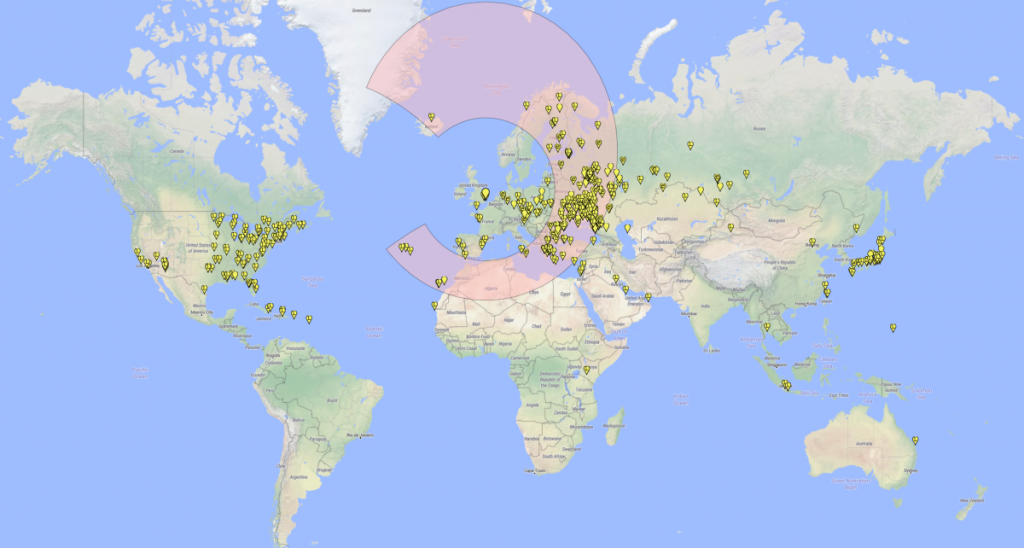
The full day coverage map lookes like this for ther 14th October:-

Something quite fascinating becomes apparent when one is able to plot to such detail.
For a start these notes are not suggest the path to Japan is via central Ukraine. The data is showing activity and the pink region is the possible peak ionisation field. So the path to Japan remains through Finland, there just are not enough active stations in that part of the the world on the day I took the snapshot
Looking eastwards from the UK there is a peak at 2500km and then NOTHING until about 9500km.
Looking westwards there is a suggestion of a peak of activity at about 2500km giving coverage of the Azores and Iceland. Activity here reflects the population centres but shows an intruiging arc from the Caribbean Islands along the US East coast suggesting a peak at around 4500km. West coast Arizona/California peak is at 9600km.
These propagation rings would be more apparent if the station locations were plotted directly on a map using great circle projection.
It looks to me as if the main propagation mode for the Asian and US is emphatically not “double-hop” but the more natural chordal-hop, or trapped wave for if it were double-hop there would be station reports from 6000km or so much stronger than the weak scattered signals reported so far.
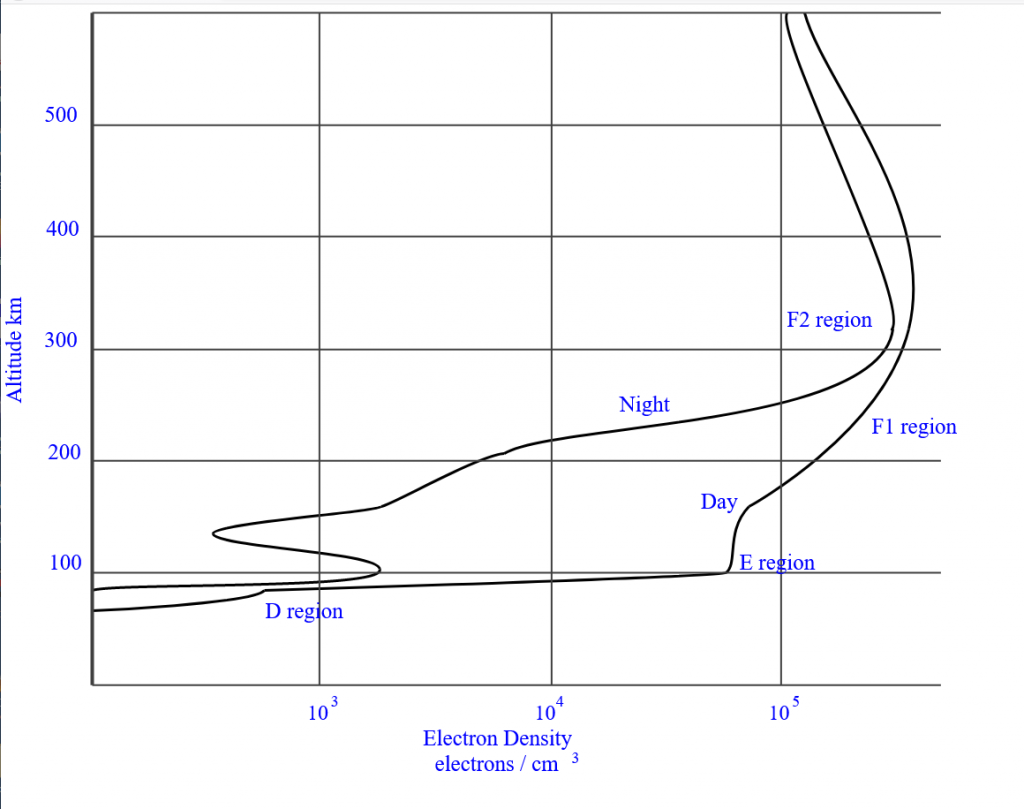
To keep things as simple as possible. Assume the ionised volume in the F2 layer is responsible so in the chart below we can probably expect peak refractivity between 250 – 300km altitude where the electron density nears (but is not quite) at its peak.
The picture below is a representation of the ionised layer boundaries and servers as an illustration only.
There are many sites providing near-realtime plots of ion density. As my main interest is the antipodian path to Oceania I favour the near-real tinme plots from Juliusruh in Northern Germany as that gives a guide as to what is happening over Finland and the Kola Peninsula. I am sure if i looked I would find data from Finland. If I do I can include it on my datasets.

Doing some sums a take-off angle of approximately 10 degrees is required to provide a single-hop out to about 2500km where peak refraction occurs at about 1250km at between 250-300km altitude. Very imprecise with its abouts and approximately but it serves to illustrate that it is a reasonable assumption.
Much weaker signals heard from Western Europe arise probably from backscatter caused by higher ionisation “clumps” or bubbles in the region boundary.
The F2 region is well known for its flatter profile compared to the F1 layer and this provides me with a clue about why signals from 9600km away (or further) can be received ar good signal levels (some Japanese stations measured 0dBft8 during 14th October 2020)
In tropospheric studies forward scatter from a refractive air mass is a well-known phenomenon. This can result in quite strong over-the-horizon scatter out ranges of 600km.
A similar forward scatter effect is noted where enhanced signals from aircraft are received from low grazing angle reflections.
It seems logical then to suggest that forward scatter is possible near the knee of the F2 region which would launch a strongly enhanced signal at a very low angle from 250km altitude. At some point this signal would encounter (perhaps near the day/night boundary) a step change in ionospheric density and be refracted again.
I haven’t done the sums yet but this descibes a sort of chordal-hop so 10,000km is not unreasonable. Antipodal propagation should also be possible (hence Guam/Australia could be via backscatter from the antipodal refractive region).
What would be of very great interest, as it would greatly enhance the understanding, is method to accurately measure the transit time for the digimode signals. Currently a dT is given in 100ms steps which makes is difficult to understand the path length.
My own PC has its clock controlled using the Meinberg application and time is within 0.005s. Agreed that with multi-tasking machines means that the timing of the transmitted elements is always non-varyingly accurate, but even a 50 or 10ms accuracy could be obtained.
A real-time clock controlled single use Arduino/RasPi could easily transmit and receive digimodes with better accuracy, enough for hf path measurements.
I lost the ability to do path measurements using Pactor II/III when I parted company with my SCS Pactor kit.
Modern GNSS receivers when put into Timing Mode can generate time interrupts at much better accuracy than the default Location Mode to clock each symbol in the transmission (including cw characters)
A final thought as I collect some more ideas together to research this topic.
This forward scatter (either from the E or F2-layer) could easily be responsible for anomalous 50MHz propagation. A particular case I have in mind is Europe to East-Coast USA during Es season. It is well known that PMSE clouds drift south during the longer summer days.
If one thinks of this as a banded region rather than discrete clouds forward scatter on the chordal path across the volume is very probable, and I would suggest highly likely.
Again an accurate determination of transmit and receive times would be required to uderstand the path length as would high quality data on PMSE zones/volumes
From my own perspective of course 50/70Mhz were good bands to hear the JW/JX beacons for extended periods during May/June. At 300okm distance and with very strong signal levels some form of forward scatter must be taking place.