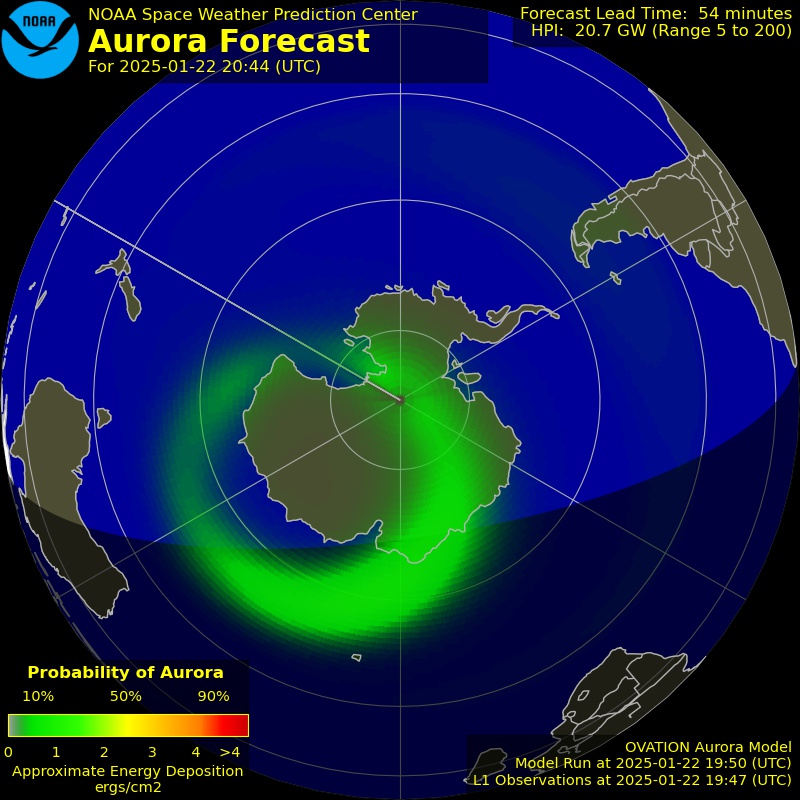
align="left"> D-Region Absorption Prediction
One of the main errors associated with the Global Positioning System (GPS)/Global Navigation Satellite System (GNSS) positioning is attributable to the ionosphere. Modern acceptance has the ionosphere extending from about 60 km altitude to more than 2000 km. The ionosphere contains a partially ionized medium, as result of the X and UV rays of solar radiation and the incidence of charged particles. Total electron content (TEC) is a versatile parameter for ionospheric studies and easily derived from the relatively low-cost dual frequency GNSS receivers. Taking advantage of the dispersive nature of ionosphere, delay due to ionosphere is derived by differencing range observations made from received signal from two frequencies. This variation can be seen quite clearly if you have a well sighted and installed external GNSS antenna and plot time across a full day. Nightime will tend to show a lower variation and daytime will tend to show higher. When the ionosphere is affected by Sun activity. TEC can increase also adding to (in this plot's case) distance errors
ESA measured TEC @ L1

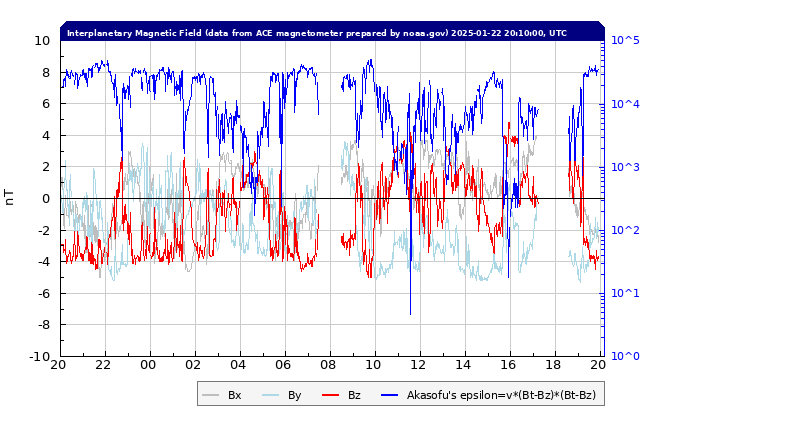
ACE Planetary Index (NOAA.gov)
Kiruna Magnetometer
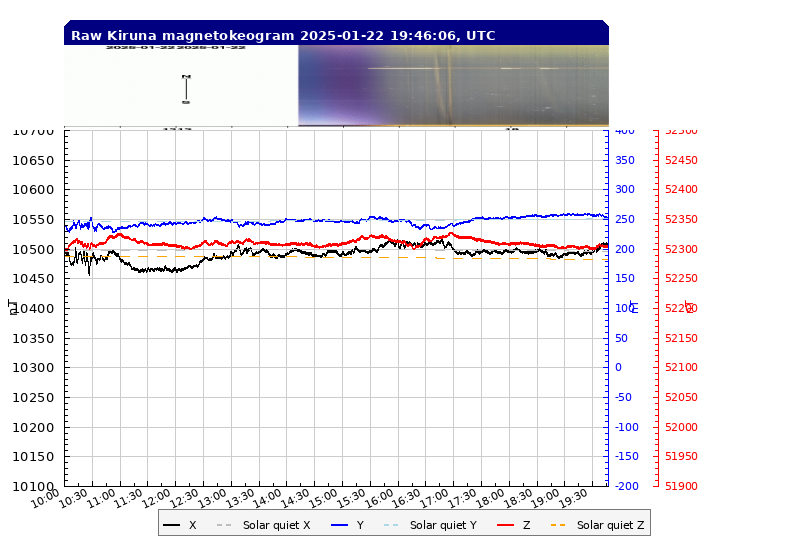
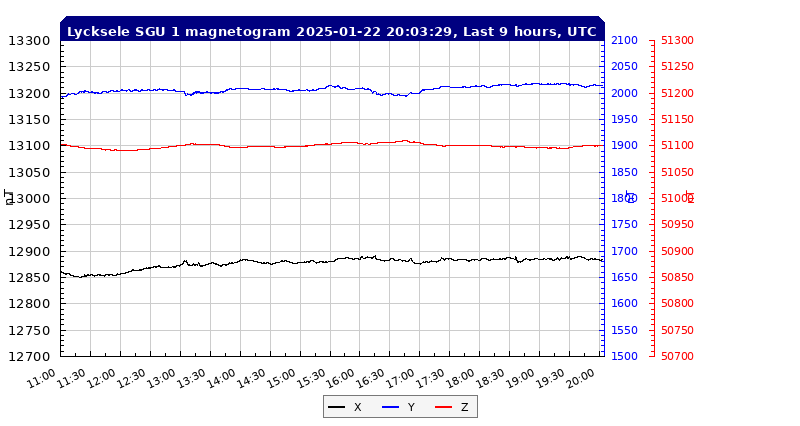
Kiruna K Index

| K-indices | Deflection in nT | |
|---|---|---|
| 0 | 0 - 15 | No chance for northern light |
| 1 | 15 - 30 | |
| 2 | 30 - 60 | |
| 3 | 60 - 120 | Chance for northern light |
| 4 | 120 - 210 | |
| 5 | 210 - 360 | |
| 6 | 360 - 600 | |
| 7 | 600 - 990 | Good chance for northern light |
| 8 | 990 - 1500 | |
| 9 | 1500 and more |
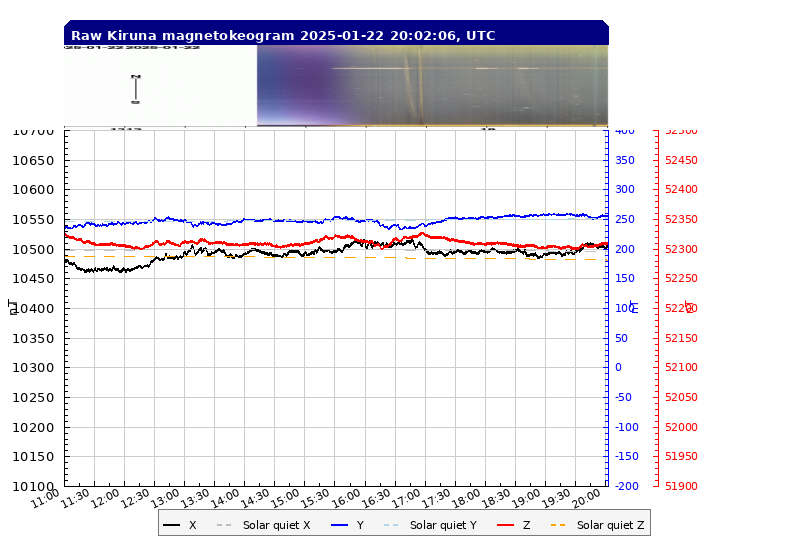
Kiruna Magnetometer
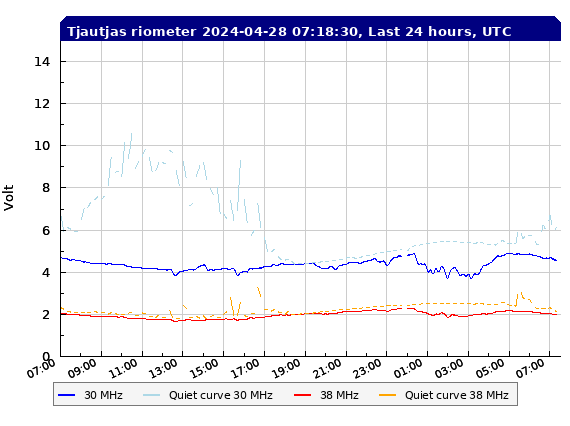
Kiruna Riometer
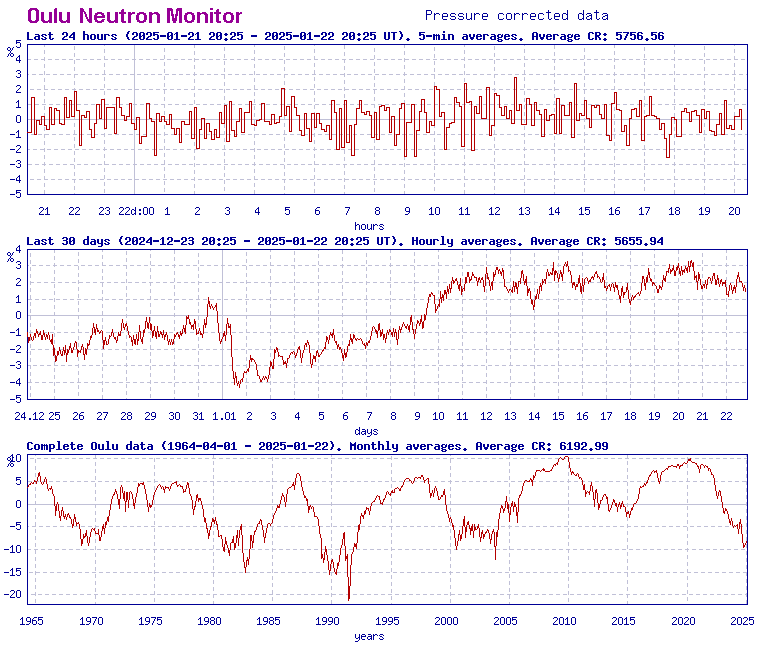
University of Oulu / Sodankyla Geophysical Observatory Cosmic Ray Station Data
The lowest chart shows the Neutron count since 1965. Of interest to HF/50MHz propgation is the overall count. It looks as if the peak count was in early 2020. Minimum levels are signs of good hf/50MHz conditions
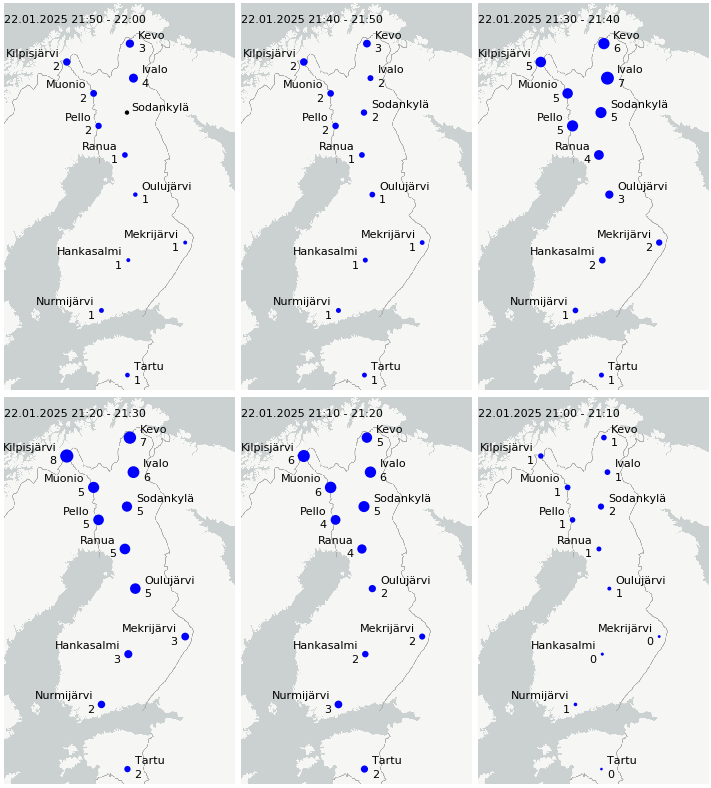
Finland Magnetometers (useful for HF/50MHz propagation disturbances from the UK)
The probability to see auroras is known to increase in Southern Finland if the magnetometer at Nurmij records relative changes larger than 0.3 nT per second calculated from minute values. The corresponding threshold for Sodankyla latitudes is about 5 nT per ten seconds. The circles on the map show the 10 minute maxima relative changes in the horizontal magnetic field components (in units 0.01 nT/s) recorded at the Nurmij,Hankasalmi, Ouluj,Sodankyla, Muonio, Kevo and Kilpisjarvi observatories during the last 24 hours. The magnetically quiet times are marked with blue circles and the disturbed times with red circles. Missing values are marked with black circles. A ten minute period is considered as disturbed if the value in scale of the plot exceeds 30 in Nurmijarvi, 35 in Hankasalmi, 42 in Oulujarvi, 50 in Sodankyla, 52 in Muonio or 57 in Kevo and Kilpisjarvi.
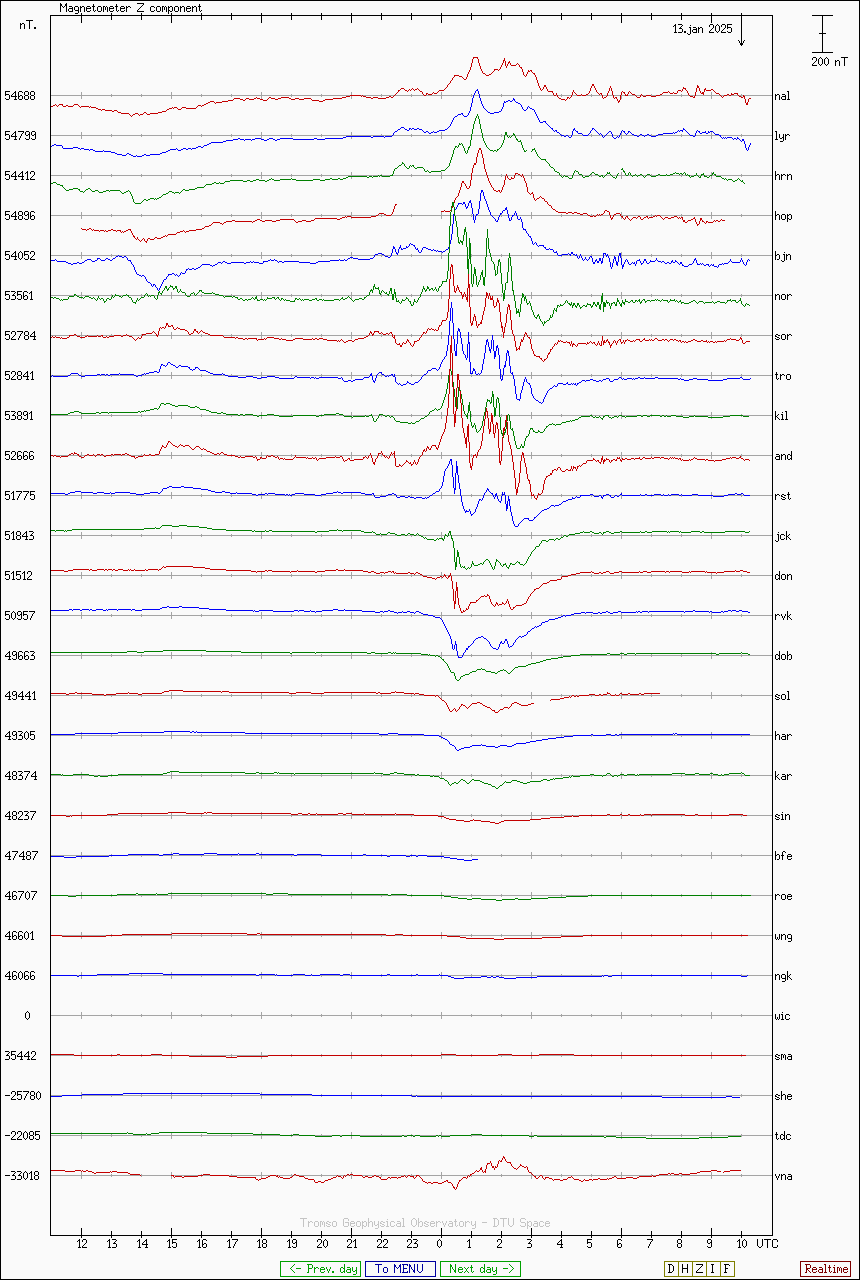
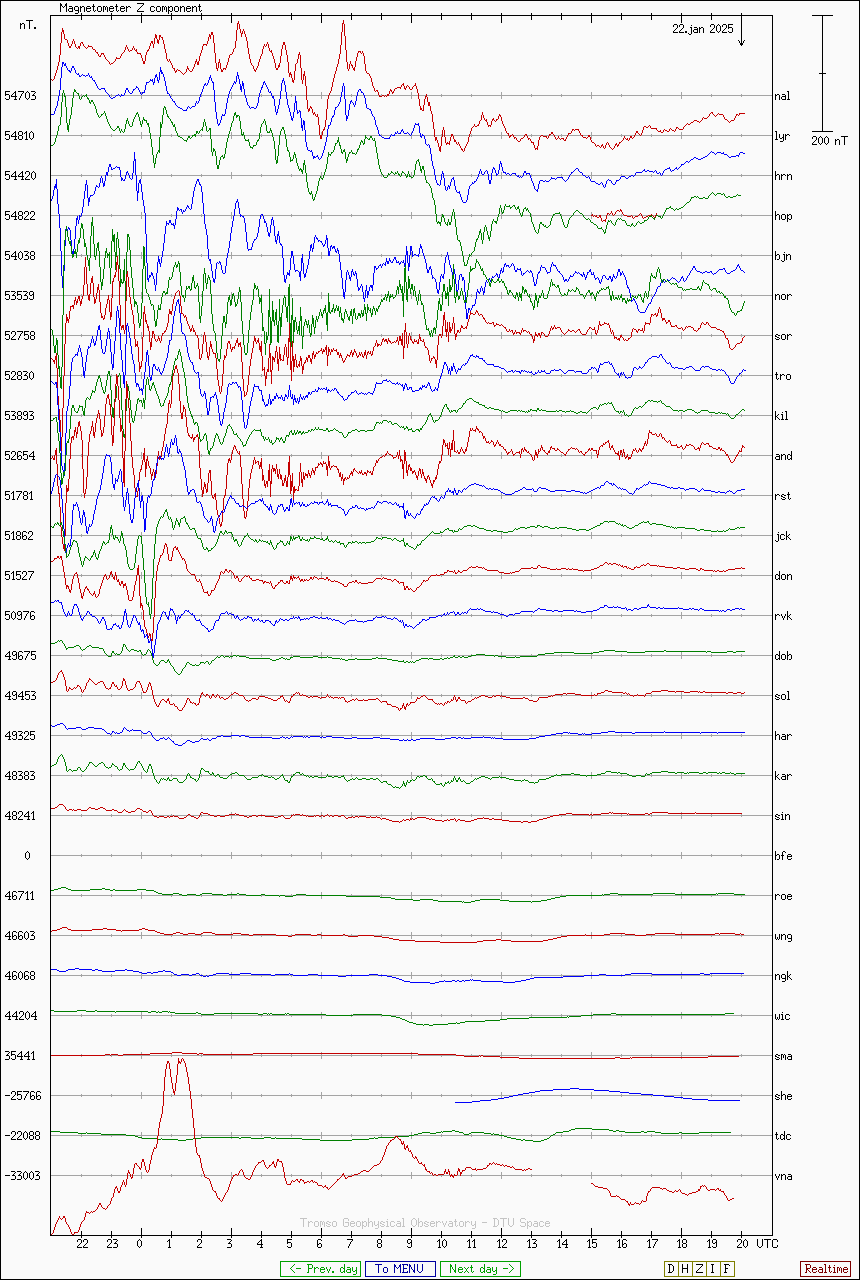
A more convential way to display the magnetometer data is through a line graph using direct magnetometer measurements in nanoTeslas. In order to reduce the amount of data presented the data sets for the Z component (BZ) are displayed as a strong downward movement in that data is usually a good indicator for radio Aurora This produces a graph with multiple wiggly lines on it but it has a serious purpose in that it is very easy to understand the extent of any disturbance particularly if the plots are arranged so that the more northerly points are displayed first.
The snapshot displayed here not only shows strength of disturbance, as in movement of the wiggly lines, but with monitoring stations ordered from the North the extent of the disturbance is clear as it progresses to the south. In this plot the northern monitoring stations are from the top (Kilpisjarvi = Kil, Kevo = Kev etc ending in the most sotherly Finnish monitoring stations at Tartu = tar)
Expressive thanks goes to Tromsø Geophysical Observatory (TGO), DTU Space (Technical University of Denmark) and Finnish Meteorological Institute (FMI) for the data.

Northern Europe Magnetometers. (Identifying potential Auroral conditions in the UK)
The Finnish data is useful for predicting the possibilty of 18MHz and upwards paths to Asia and Oceania. It also helps in correlating reception reports of the frequent visits to the UK of OH9TEN (28MHz), OH9SIX (50MHz), and OH9VHF (144MHz) beacons near Sodankyla.
From the UK a path to Asia/Oceania might exist if the relative magnetometer readings are 2 or less at Ranau, Oulu, and Mekri. The more southerly magnetometer stations will have the same or lower values. If the values are 5 or more then a path is unlikely to exist, but that doesn't mean not to try it as some surprising results may present themselves.
With that in mind a more comprehensive dataset from Northern European observatories can provide a better indication of overall Auroral conditions. The top five lines in the chart are data from Svalbard with Ny Ålesund (nal) on the west coast, and Longyearbyen (lyr) in the central part, Hornsund (hrn), Hopen (hop) and Bjørnøya (bjn). This group of data could be directly correlated with reception of 28/50MHz beacons in central Europe.
Northern Norway is represented with magnetometers at Nordkapp (nor) [lovely place to visit], Sørøya (sor) and Tromsø (tro). Useful when logging reception of the beacons in JP99EC, LA7SIX on 50MHz and LA7VHF on 70MHz.
The data is provided by Tromsø Geophysical Observatory (http://geo.phys.uit.no/) and the Technical University of Denmark (DTU) (https://www.space.dtu.dk/English/) and the Finnish Meteorological Institute (https://space.fmi.fi/)
Aurora detection is more or less well developed these days with magnetometer, Riometers, visual observations and multi-spectral all-sky cameras.
However Auroral Sporadic E, if that is the correct name for an as yet not well defined mode is more difficult to forecast or predict.
On the evening of 17th August 2021 from about 20:00 utc VLF signals were disrupted . GBR-Anthorn on 19.58kHz suffered stronger than usual amplitude and phase disruption.
At the same time the signal from NWC - Exmouth, Aus on 19.8kHz increased substantially, equalling Anthorn in strength at its peaks. Very slow (minutes) amplitude variation being observed.
Noted also was a change in amplitude and phase of the RSDN-20 transmission on 11.5kHz suggesting a change taking place in the D-layer (boundary).
This situation continued throughout the evening and SM0AXY reported reception of 50MHz beacons, JW9SIX, OH9SIX and LA7SIX.
SM4AXY 50451.0 LA7SIX 18 2155Z 17 JO79LG - JP99EC
SM4AXY 50417.0 OH9SIX 31 2156Z 17 JO79LG - KP36OJ
SM4AXY 50475.0 JW9SIX 12 2159Z 17 JO79LG - JQ94LM
To help a little in understanding propagation conditions in the Auroral Zone, the Reverse Beacon Network provides a chance to correlate activities.
Unfortunately of the most northerly beacons on 50MHz only data for JW7SIX seems to be available on RBN.
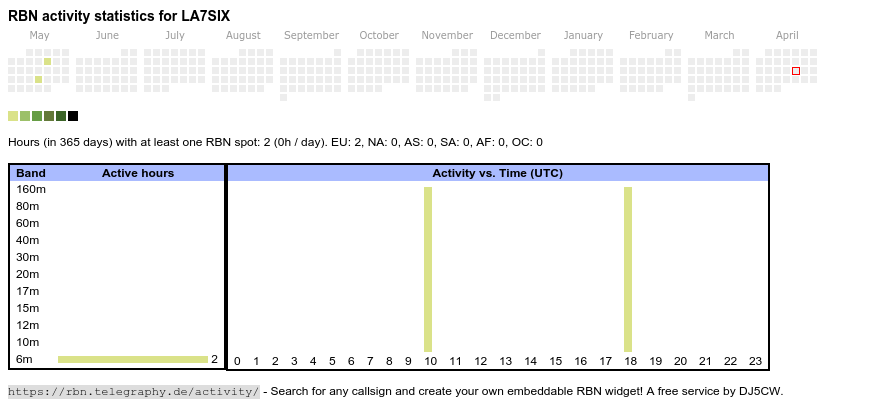
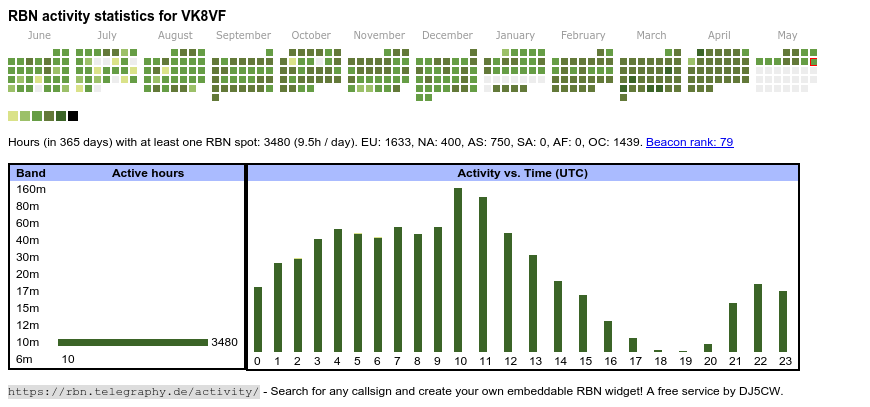
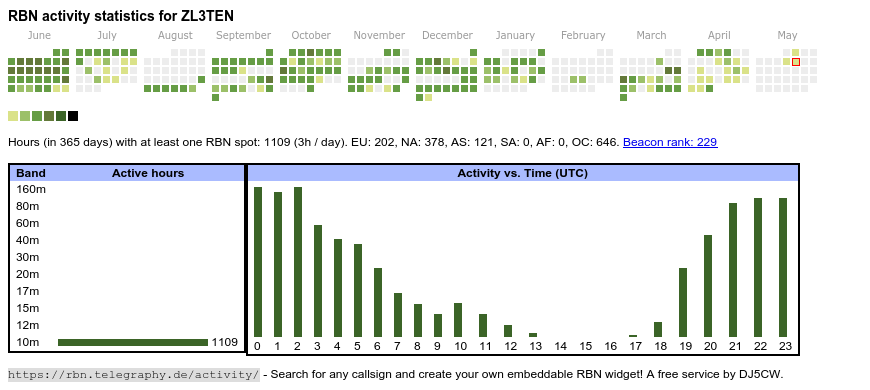
Each beacon has a calendar entry indicating which month the beacon was received. Then there is a bar chart indicating the time of day reception was made over the whole year.
OH9TEN/OH9SIX and LA7SIX beacons are most frequently received between 07-09utc which coincides with my openings to Japan on both 28 and 50MHz.
It is no real surprise as these beacons are close to my Great Circle path to Asia/Oceania.
The RBN data does not differentiate between propagation modes so some further analysis is required to identify month and propagation mode.
Having said that the data does show the best times to hunt for these northern European signals.
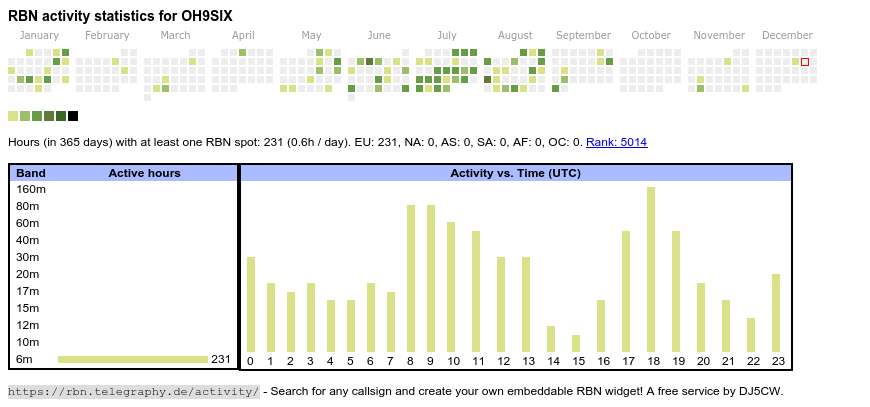

VY0YHK nr Nunavut (EP28bo) on 50.038 MHz is usually a good catch (i.e. hard)

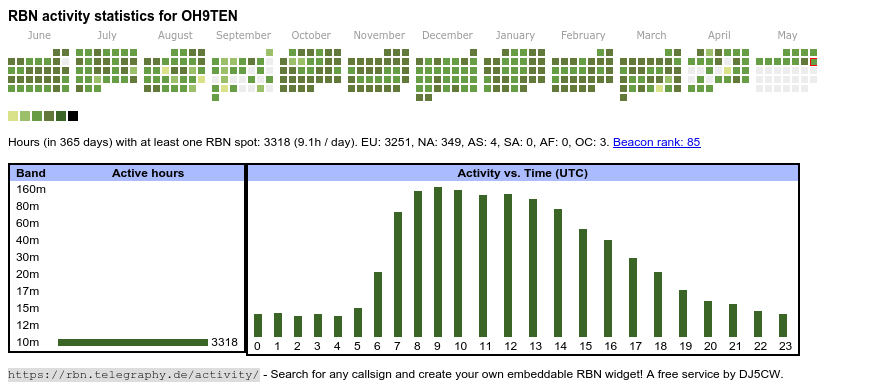
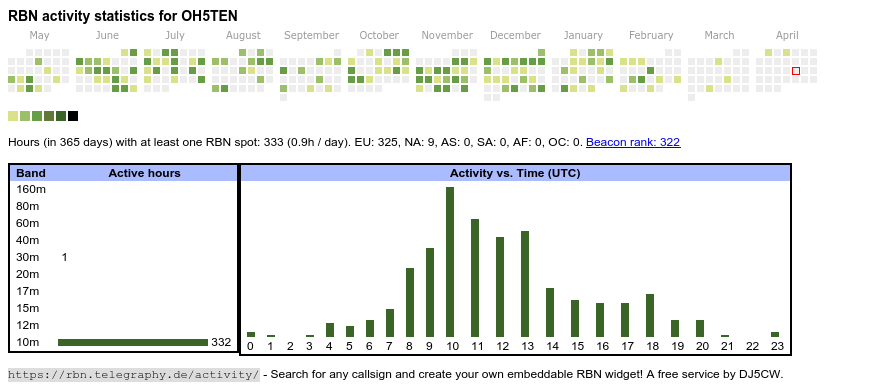
For comparison the very reliable VK8VF beacon and comparatively rare in Europe ZL3TEN.
Riometer Absorption Data
Riometer data could be of great value in correlating F,E and D layer electron density levels across super long 50MHz contacts..trouble is there are not many about :-)
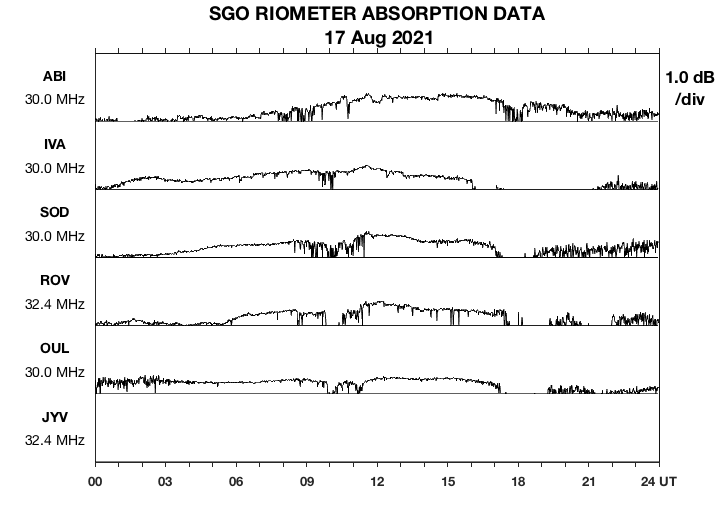
Looking at the above SGO Riometer Absorption data for 17th August 2021 it can be seen that around the time frame discussed earlier (1800-2400utc) the data plot
showed low but noisy (fluctuating amplitude) suggesting a disturbance of some kind.
It could be inferred that VLF paths are transpolar (night-time pole to pole) which rather opens up several questions on the propagation mechanisms.
Here is the latest Riometer daily plot from the Finland observatories. thanks to FMI. It only seems to update on workdays and is not 100% reliably active at other times, but it is the best resource I can find so far.
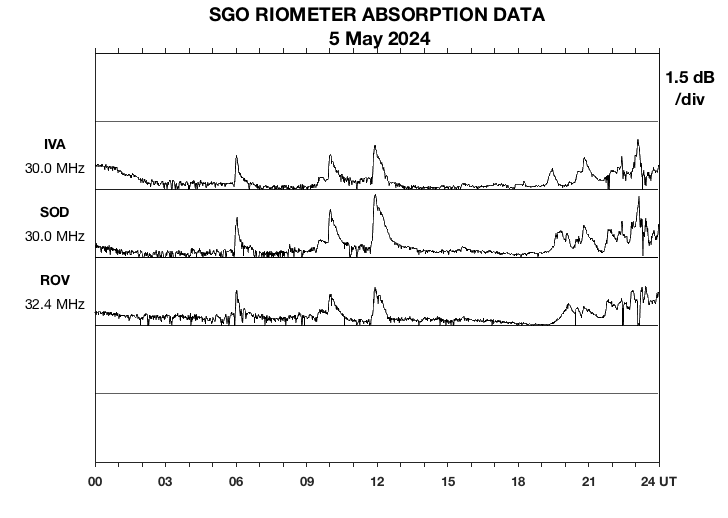
It is likely the results of observations between beacons, riometers, and auroral activity are highly correlated but further monitoring and recording of these results is required to provide more certain correlation.
RSDN-20 Network 5th January 2023
Relatively up to date operational status of the RSDN-20 is dsiplayed in the image below. I retrieve it from Gorno-Altaisk State University, Gorno-Altaisk, Russia. The data represents their continued contribution to the Worldwide Lightning Location Network (WWLLN) but by happenstance gives me a good view of RSDN-20.
Further I have discovered two more sources of lightning data that give a good indication of RSDN-20 network reception.
This one is Sheffield in the UK.

And this one from Dunedin in New Zealand.

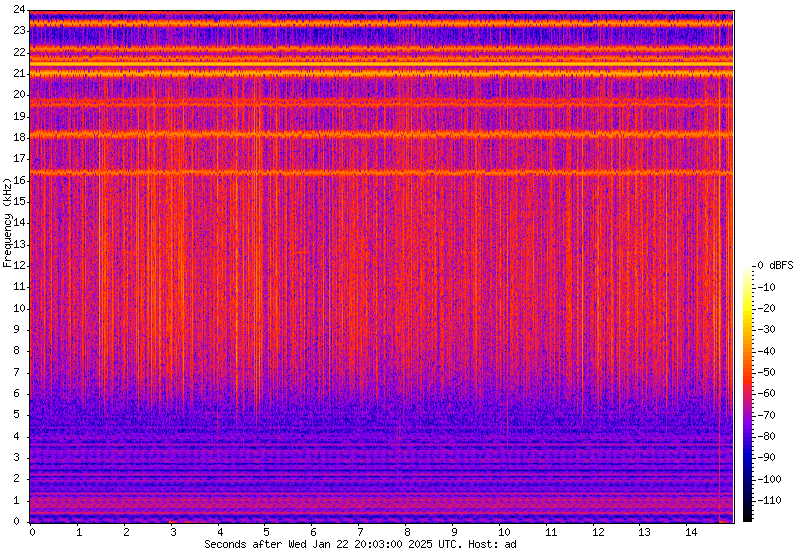
Here is a spectrogram captured on 5th January 2023 locally in south-east England showing current use of the three main frequencies.
External noise levels tend to drop by as much as 10dB in late afteroon through until early morning at VLF. The limiting factor that prevents extended monitoring is lightning.I have correlated strikes with receiver crackles from North America and the Gulf of Mexico through to North- Eastern Australia.
The top set of beeps are 14.880952kHz and can be quite strong (20dBn) but the 11 and 12 kHz signals are weaker and sometimes get submerged in local noise. Below 12kHz my active antenna is starting to fall away, although lightning static is still impressively present down to 8kHz.
Having said that after some comparison measuremnets with/without antenna connected I see noise rise by around 10dB when I connect the antenna.

One of the investigations underway during 2023 is a detailed look at the RSDN-20 network. Many listeners are happy to see/hear the carriers beeping away but each carrier on 11.904761, 12.648809 and 14.880952 kHz comprises multiple sub-carriers (until I think of a better term) spaced 0.277777 Hz apart. These sub-carriers are subject to fading probably phase shift on the path. Superbly illustrated in this close-in view of the 11.904761 kHz transmission. The wavy indistinct trace at the start of the plot is due to having an incorrect sampling rate selected in the path to the digitising software.

Operationally RSDN-20 transmission appears to be subject to long outages (days and months) for maintenance and adjustment purposes.
The spectrograph here shows three frequencies audible with 14KHz showing Krasnodar, a gap, Novosibirsk, Novosibirsk. 12kHz as gap, Novosibirk, gap then Krasnodar followed by a gap. 11kHz shows Novosibirk, gap, and Krasnodar, gap, in that order. Interesting is that Revda (Murmansk) is not active. A few days before the three transmitters at Kharbarovsk, Krasnodar and Novosibirsk re-appeared I logged for a few days in succession during late afternoons weak and identifiable signal that appeared to emanate from the Far-East station, Kharbarovsk. The whole RSDN-20 system is subject to regular maintenance periods that apparently can take a few weeks, so that will explain the gaps is service.
The transmitter at Seyda is unlikley to be active (it is in Turkmenistan so subject to payments and permissions) and Kharbarovsk is very likley to be active but will be quite weak at best here is South-East UK. Here is the capture of what I think is the Kharbarovsk station on 14.881kHz between 14.35utc and 19.00utc on 3rd January 2023. I believe there was a solar disturbance in progress at the time so the D-layer may have had a warp. It could also be due to the twilight/night path to the East. On 20230108 1700utc onwards through the evening I confirmed to myself that I received all three operating stations on 11.904761kHz. Again Kharbarovsk was weak but audible pulses arrived within the appropriate window, the path exhibiting quite deep pulse-to-pulse fading.

As if by magic the elusive Far-East RSDN-20 station appeared from about 13.00utc onwards (to 19.00utc) 20230107 on 14.880952Khz thus showing the system is functioning normally. Analysis of the "beeps" in the audio spectrum shows that the second Novosibirk "beep" is 0.138Hz higher. The SBSpectrum software used to monitor the audio spectrum indicates that one beep on 14kHz is offset by this figure.

It may be a little difficult to see but the signal from Kharbarovsk is in the gap between the first and just before the twin pair of peeps. It is a faint blue mark. Clearly audible on the sound recodring that I may included at a later date. The sequence on the screen is Krasnodar, Kharbarovsk, Novosibirk, Novosibisk. The last beep (second one from Novosibirsk is 0.138Hz higher in frequency. So the two Novosibirsk beeps between them act as the timing and frequency alignment. The Revda or Seyda stations would have allowed the system to work as designed without the need for the extra Novosibirsk transmission. As thos stations are either unavailable or not operational I believe the desion to use Novosibirsk on frequency F3p (14.881091kHz) provided the best compromise solution.
20230121 ----- Solar disturbance
More of a quick note to self as I prepare a more thoughtful analysis.
Spectrom and Doppergrams of 11.905kHz overnight revealed a number of different effects, both in time and frequency, to the RSDN-20 signal on 11/904761kHz signal.
Krasnodar and Novosibirsk are very weak with variously one or the other completely disappearing on a pulse to pulse basis.
Amplitude variation on the complete 4.45Hz signal is quite high, ranging from +3dB to -4dB over about a 30sec period.
This figure shows a capture of the 11.905kHz pulse stream at a very level (-4.5dB), seconds later the signal dropped further before recovering to +3dB (vertical scale is 10dB per division).
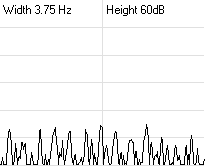
Selective fading of the subcarriers is quite fast (seconds rather than the usual minutes/hours).
Finally there appears to be some smearing of subcarrier in frequency. This effect maybe due to a magnetic field aligned anomaly causing frequency dispersion of the pulses.
Look aroung 0530 to 0630utc (carefully - one eye shut and the head tilted to one side --- in joke) and it should just about be possible to see some vertical lines from pulse smearing. This figure also shows selective amplitude fading of sub-carriers.
Long term observation indicates two types of fading, one that sweeps through the signal causing neighbouring sub-carriers to fade together and one where individual sub-carriers fade.

Much more work underway to finesse the VLF receive system and more time attributed to look for the exclusive frequencies sometimes employed from other sites. The NATO and RDL transmissions netween 16 and 25 kHz are excellent sources for monitoring D-layer changes either though solar disturbances or simply noting the phase changes through the sidebands (and signal amplitude changes) during sunrise/sunset times.
As part of this preparation I started looking at the precision of the Standard Positioning Service (SPS) from the GPS constellation.

...and finally but not quite. Thanks to AuroraWatch UK this is the current status in the UK
This image is an indicator of the current ionospheric data and is supplied via the Lowell GIRO Data Centre. They obviously tried very hard to discover a catchy name as the name of the model is called Global Assimilatative Model of Bottomside Ionosphere Timeline (GAMBIT). You couldn't make it up - well they obviously did!
This is a very tentative spot for the data which should be near-real time for the south-east of England